

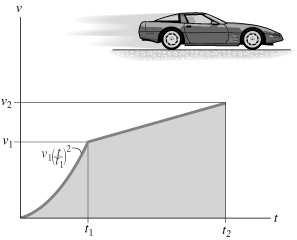
The v-t graph for the motion of a car as if moves along a straight road is
Question:
The v-t graph for the motion of a car as if moves along a straight road is shown. Draw the a-t graph and determine the maximum acceleration during the time interval 0 2. The car starts from rest at s = 0. Given: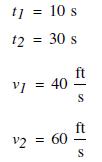
Fantastic news! We've Found the answer you've been seeking!
Step by Step Answer:
TI 0001t1t1 T2 t1 101t112 aj 71 a...View the full answer

Answered By
ALBANUS MUTUKU
If you are looking for exceptional academic and non-academic work feel free to consider my expertise and you will not regret. I have enough experience working in the freelancing industry hence the unmistakable quality service delivery
178+ Reviews
335+ Question Solved
Related Book For 
Question Posted:
