

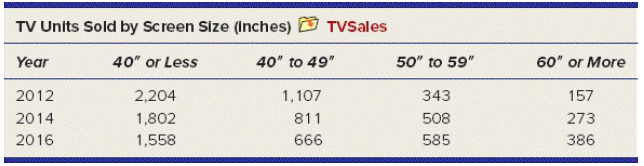
The table shows the number of TVs sold by a major retailer in California for three years.
Question:
The table shows the number of TVs sold by a major retailer in California for three years.
(a) Use Excel to prepare a 2-D side-byside column chart with screen size on the horizontal axis.
(b) Change your graph to a 3-D side-by-side column chart. Is 3-D better than 2-D? Explain.
(c) Change the chart type to a 3-D stacked column chart. Is the stacked chart a better way to compare sales over time or among screen sizes?
(d) Right-click the data series, choose Add Data Labels, and add labels to the data. Do the labels help or hinder viewer understanding?
Fantastic news! We've Found the answer you've been seeking!
Step by Step Answer:
a b Many individuals will see the 3D as more distracting Whe...View the full answer

Answered By
Subash Murugaih
I am leading expert in this web site couple of years and My clients are much happy with my works and services.
309+ Reviews
539+ Question Solved
Related Book For 

Essential Statistics In Business And Economics
ISBN: 9781260239508
3rd Edition
Authors: David Doane, Lori Seward
Question Posted:
