

The following table shows the components of M1 and M2 in billions of dollars for the month
Question:
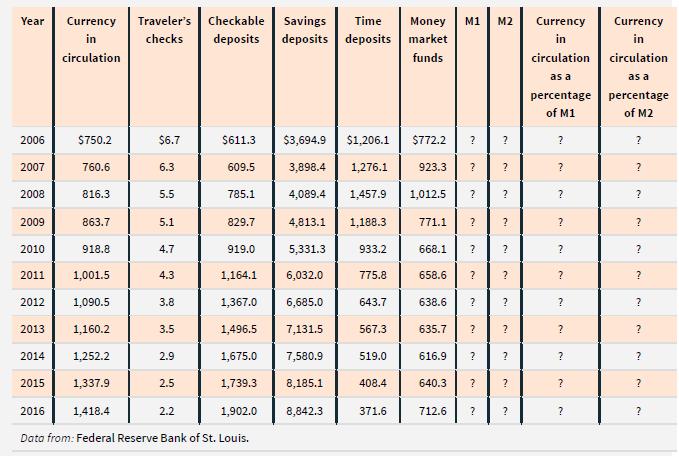
The following table shows the components of M1 and M2 in billions of dollars for the month of December in the years 2006 to 2016, reported by the Federal Reserve Bank of St. Louis. Complete the table by calculating M1, M2, currency in circulation as a percentage of M1, and currency in circulation as a percentage of M2. What trends or patterns about M1, M2, currency in circulation as a percentage of M1, and currency in circulation as a percentage of M2 do you see?
What might account for these trends?
Fantastic news! We've Found the answer you've been seeking!
Step by Step Answer:

Answered By
Deborah Joseph
My experience has a tutor has helped me with learning and relearning. You learn everyday actually and there are changes that are made to the curriculum every time so being a tutor has helped in keeping me updated about the present curriculum and all.
I have also been able to help over 100 students achieve better grades particularly in the categories of Math and Biology both in their internal examinations and external examinations.
2+ Reviews
10+ Question Solved
Related Book For 
Question Posted:
