Conduct the following analyses for the Internet usage data given in Applied Problem 11-18 in Chapter 11.
Question:
Conduct the following analyses for the Internet usage data given in Applied Problem 11-18 in Chapter 11.
a. Find the simple correlations between the following sets of variables: Internet usage and attitude toward the Internet, Internet usage and attitude toward technology, and attitude toward the Internet and attitude toward technology. Interpret the results.
b. Run a bivariate regression, with Internet usage as the dependent variable and attitude toward the Internet as the independent variable. Interpret the results.
c. Run a bivariate regression, with Internet usage as the dependent variable and attitude toward technology as the independent variable. Interpret the results.
d. Run a multiple regression, with Internet usage as the dependent variable, and attitude toward the Internet and attitude toward technology as the independent variables. Interpret the results.
Applied Problem 11-18 in Chapter 11
11-12. In each of the following situations, formulate the null and alternative hypotheses.
a. A new product will be introduced if it is preferred by more than 70 percent of the consumers in the target market.
b. A new commercial will be aired if the average preference for it exceeds 5.8 on a 7-point scale.
c. A company will start selling its products online if more than 55 percent of the consumers express a preference for online purchasing.
d. The average price of a pair of jeans available in the marketplace exceeds $45.
e. Less than 40 percent of the people approve of Barak Obama’s presidency.
f. The mean familiarity with banks is different than 4.0 on a 7-point scale.
11-13. In each of the following situations, indicate the statistical analysis you would conduct and the appropriate test or test statistic that should be used.
a. Respondents in a survey of 1,000 households were classified as heavy, medium, light, or nonusers of ice cream. They also were classified as being in high-, medium-, or lowincome categories. Is the consumption of ice cream related to income level?
b. In a survey using a representative sample of 2,000 households from the TNS consumer panel, the respondents were asked whether they preferred to shop at Sears. The sample was divided into small and large households based on a median split of household size.
Does preference for shopping in Sears vary by household size?
11-14. The current advertising campaign for a major soft-drink brand would be changed if less than 30 percent of the consumers like it.
a. Formulate the null and alternative hypotheses.
b. Discuss the type I and type II errors that could occur in hypothesis testing.
11-15. A major department store chain is having a sale on refrigerators. The number of refrigerators sold during this sale at a sample of ten stores was:![]()
a. What are the mean, mode, and median? Which measure of central tendency is most appropriate in this case and why?
b. What are the variance and the standard deviation?
c. Construct a histogram, and discuss whether this variable is normally distributed.
11-16. In a study measuring households’ familiarity with downloading pictures from the Internet, the following results were obtained (1 = not at all familiar, 7 = very familiar).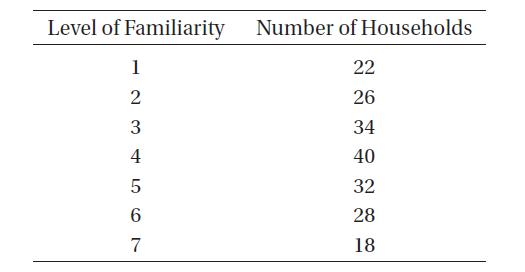
a. Convert the number of households into percentages.
b. Calculate the cumulative percentages.
c. Construct a histogram with familiarity on the x-axis and frequency on the y-axis.
d. What are the mean, median, and mode of the distribution?
11-17. A research project examining the impact of income on the consumption of gourmet foods was conducted. Each variable was classified into three levels of high, medium, and low.
The following results were obtained.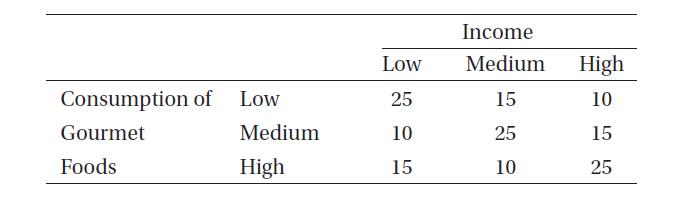
What is the pattern of the relationship between income and consumption of gourmet food?
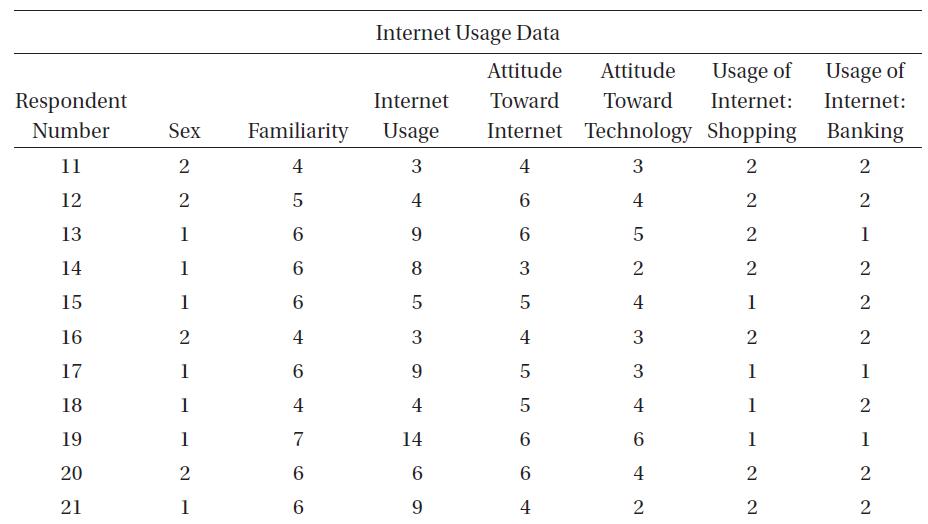
11-18. A pilot survey was conducted with thirty respondents to examine Internet usage for personal (nonprofessional) reasons. The following table contains the resulting data giving each respondent’s sex (1 = male, 2 = female); familiarity with the Internet (1 = very unfamiliar, 7 = very familiar); Internet usage in hours per week; attitude toward Internet and toward technology, both measured on a 7-point scale (1 = very unfavorable, 7 = very favorable); and whether the respondent shopped or banked online (1 = yes, 2 = no).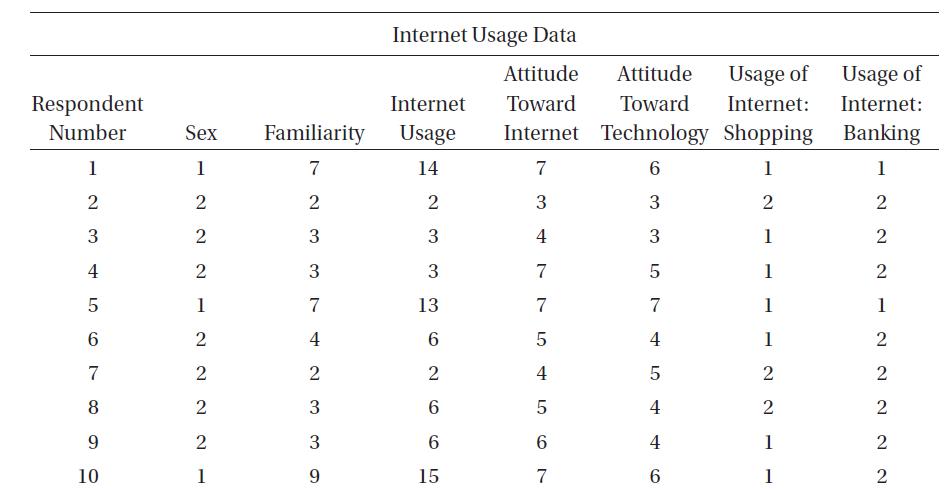
a. Obtain the frequency distribution of familiarity with the Internet. Calculate the relevant statistics.
b. For the purpose of cross-tabulation, classify respondents as light or heavy users. Those reporting five hours or less usage should be classified as light users and the remaining as heavy users. Run a cross-tabulation of sex and Internet usage. Interpret the results. Is Internet usage related to one’s sex?
Step by Step Answer: