

The following data on y = concentration of penicillin-G in pigs blood plasma (units per milliliter) and
Question:
The following data on y = concentration of penicillin-G in pig’s blood plasma (units per milliliter) and x = time (in minutes) from administration of a dose of penicillin (22 mg/kg body weight) appeared in the paper “Calculation of Dosage Regimens of Antimicrobial Drugs for Surgical Prophylaxis” (Journal of the American Veterinary Medicine Association [1984]: 1083–1087):
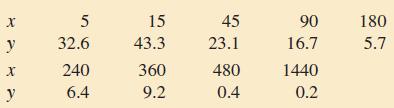
a. Construct a scatterplot for these data.
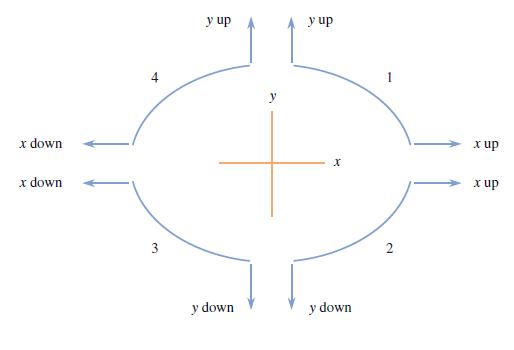
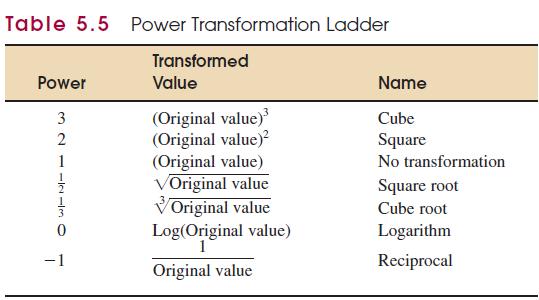
b. Using the ladder of transformations of Section 5.4 (see Figure 5.31 and Table 5.5), suggest a transformation that might straighten the plot. Give reasons for your choice of transformation.
Figure 5.31
Step by Step Answer:

This question has not been answered yet.
You can Ask your question!
Related Book For 

Introduction To Statistics And Data Analysis
ISBN: 9780495118732
3rd Edition
Authors: Roxy Peck, Chris Olsen, Jay L. Devore
Question Posted:
