

An article in Microelectronics Reliability [Advanced Electronic Prognostics through System Telemetry and Pattern Recognition Methods, (2007, 47(12),
Question:
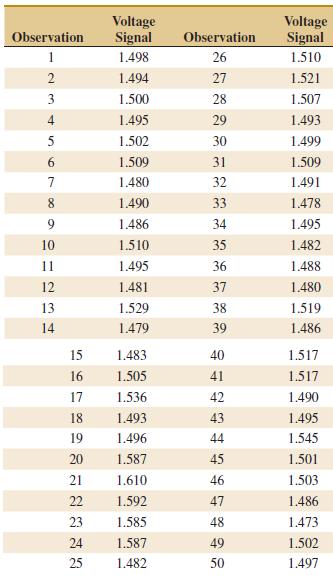
An article in Microelectronics Reliability [€œAdvanced Electronic Prognostics through System Telemetry and Pattern Recognition Methods,€ (2007, 47(12), pp. 1865€“1873)] presented an example of electronic prognostics (a technique to detect faults in order to decrease the system downtime and the number of unplanned repairs in high-reliability and high-availability systems). Voltage signals from enterprise servers were monitored over time. The measurements are provided in the following table.
(a) Using all the data, compute trial control limits for individual observations and moving-range charts. Construct the chart and plot the data. Determine whether the process is in statistical control. If not, assume that assignable causes can be found to eliminate these samples and revise the control limits.
(b) Estimate the process mean and standard deviation for the in-control process.
(c) The report in the article assumed that the signal is normally distributed with a mean of 1.5 V and a standard deviation of 0.02 V. Do your results in part (b) support this assumption?
Step by Step Answer:
a Both charts have points outside of the control limits For the I chart observations 2024 are out o...View the full answer


Applied Statistics And Probability For Engineers
ISBN: 9781118539712
6th Edition
Authors: Douglas C. Montgomery, George C. Runger
