

Two samples of students, one comprised of social science majors and one comprised of students with other
Question:
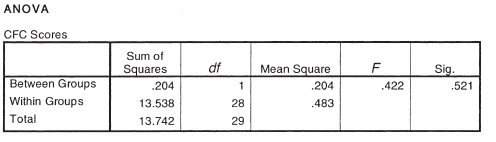
a. Demonstrate that the results of the independent samples t test and the one-way between-groups ANOVA are the same.
b. In statistical software output, €œSig.€ refers to the actual p level of the statistic. We can compare the actual p level to a cutoff p level such as 0.05 to decide whether to reject the null hypothesis. What are the €œSig.€ levels for the two tests here€” the independent-samples t test and the one-way between-groups ANOVA? Are they the same or different? Explain why this is the case.
c. In the CFC ANOVA, the column titled €œMean Square€ includes the estimates of variance. Show how the F statistic was calculated from two types of variance.
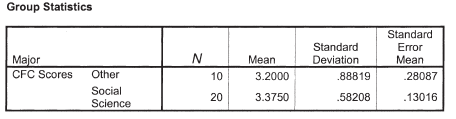
d. Looking at the table titled €œGroup Statistics,€ how many participants were in each sample?
e. Looking at the table titled €œGroup Statistics,€ what is the mean CFC score for the social science majors?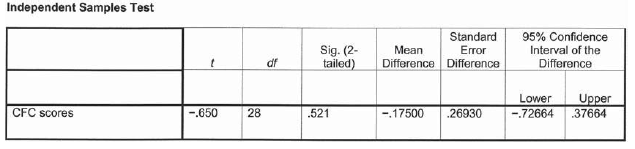
Step by Step Answer:
a The F statistic 0422 is the square of the t statistic 20650 The Sig is the same in both tests 052...View the full answer


Essentials Of Statistics For The Behavioral Sciences
ISBN: 9781464107771
3rd Edition
Authors: Susan A. Nolan
