

(a) Make a chart similar to Fig. 6.9 showing the price of a put option using a...
Question:
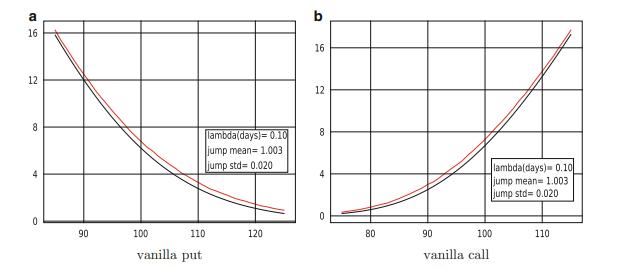
(a) Make a chart similar to Fig. 6.9 showing the price of a put option using a difference IG model for stock prices versus the GBM model. Use a− = a+ = 41 and b− = b+ = 8. What are the mean and variance of the difference IG process?
(b) Do the same for calls.
Data Given in Figure 6.9
Fantastic news! We've Found the answer you've been seeking!
Step by Step Answer:

Answered By
Muhammad Ghyas Asif
It is my obligation to present efficient services to my clients by providing a work of quality, unique, competent and relevant. I hope you have confidence in me and assign me the order and i promise to follow all the instructions and keep time.
109+ Reviews
203+ Question Solved
Related Book For 

Question Posted:
