

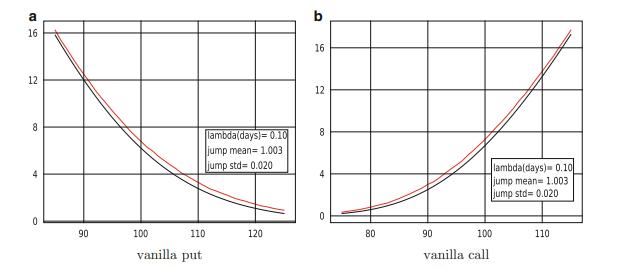
(a) Make a chart similar to Fig. 6.9 showing the price of a put option using the...
Question:
(a) Make a chart similar to Fig. 6.9 showing the price of a put option using the jump diffusion model with lognormal jumps for stock prices versus the GBM model. In order to compare the results with jump diffusion using N(μJ , σ2 J) jumps, find α and β to match the mean and variance,
![]()
(b) Do the same for calls.
Data Given in Figure 6.9
Fantastic news! We've Found the answer you've been seeking!
Step by Step Answer:

Answered By
GOVIND BHAGWAT
Since Feb 2008, as a professional freelancer, I am engaged in consultancy, mentoring and tutoring in various finance and business related topics. Prior to that, I worked for more than 20 years in different managerial capacities with domestic and multinational companies. My prime responsibilities as a part of senior management were to be a problem solver specialist in finance and mentoring of team members. Imparting and sharing of knowledge & skills sets gives me a very enriching and fulfilling experience. This is the main philosophy of my overall career.
0 Reviews
10+ Question Solved
Related Book For 

Question Posted:
