

Hasbro is a leading firm in the toy, game, and amusement industry. Its promoted brands group includes
Question:
REQUIRED
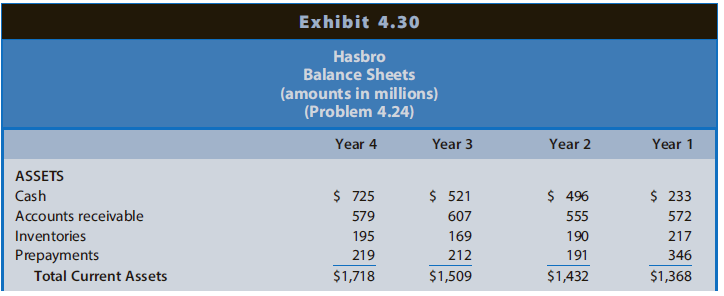
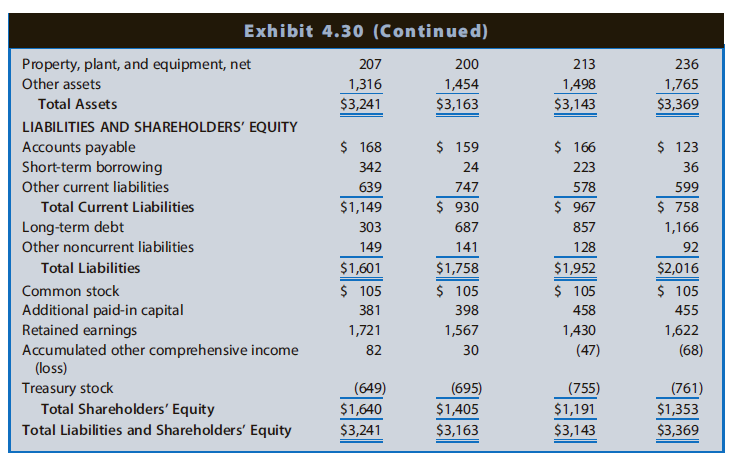
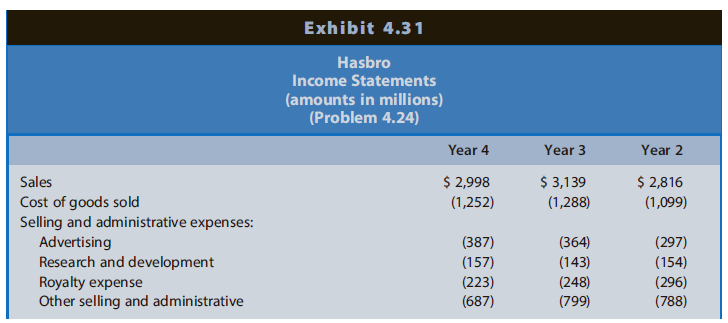
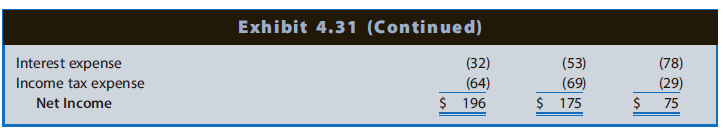
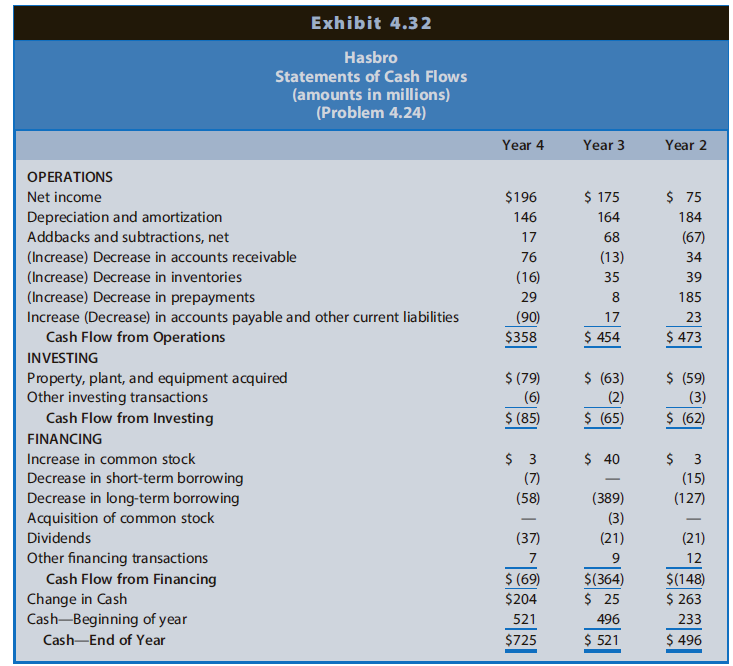
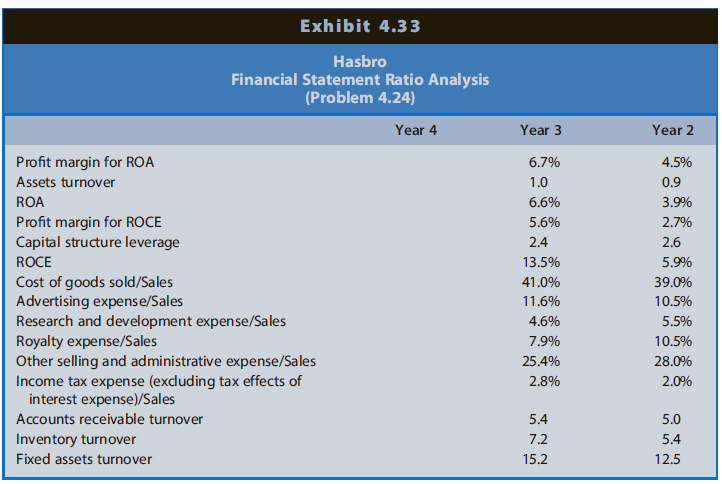
a. Exhibit 4.33 presents profitability ratios for Hasbro for Year 2 and Year 3. Calculate each of these financial ratios for Year 4. The income tax rate is 35%.
b. Analyze the changes in ROA and its components for Hasbro over the three-year period, suggesting reasons for the changes observed.
c. Analyze the changes in ROCE and its components for Hasbro over the three-year period, suggesting reasons for the changes observed.
The term is enough to curl one's hair, conjuring up those complex problems we encountered in high school math that left many of us babbling and frustrated. But when it comes to investing, that need not be the case. In fact, there are ratios that,...
Fantastic news! We've Found the answer you've been seeking!
Step by Step Answer:
a Profit Margin for ROA 196 1 035322998 72 Assets Turnover 2998053163 3241 09 Return on Assets 196 1 0 3532053163 3241 68 Profit Margin for ROCE 1962998 65 Capital Structure Leverage 053163 3241051405 ...View the full answer

Answered By
Asim farooq
I have done MS finance and expertise in the field of Accounting, finance, cost accounting, security analysis and portfolio management and management, MS office is at my fingertips, I want my client to take advantage of my practical knowledge. I have been mentoring my client on a freelancer website from last two years, Currently I am working in Telecom company as a financial analyst and before that working as an accountant with Pepsi for one year. I also join a nonprofit organization as a finance assistant to my job duties are making payment to client after tax calculation, I have started my professional career from teaching I was teaching to a master's level student for two years in the evening.
My Expert Service
Financial accounting, Financial management, Cost accounting, Human resource management, Business communication and report writing. Financial accounting : • Journal entries • Financial statements including balance sheet, Profit & Loss account, Cash flow statement • Adjustment entries • Ratio analysis • Accounting concepts • Single entry accounting • Double entry accounting • Bills of exchange • Bank reconciliation statements Cost accounting : • Budgeting • Job order costing • Process costing • Cost of goods sold Financial management : • Capital budgeting • Net Present Value (NPV) • Internal Rate of Return (IRR) • Payback period • Discounted cash flows • Financial analysis • Capital assets pricing model • Simple interest, Compound interest & annuities
65+ Reviews
86+ Question Solved
Related Book For 

Financial Reporting Financial Statement Analysis and Valuation a strategic perspective
ISBN: 978-1337614689
9th edition
Authors: James M. Wahlen, Stephen P. Baginski, Mark Bradshaw
Question Posted:
