Based on Exhibit 2, the implied credit and liquidity risks as indicated by the historical three-year swap
Question:
Based on Exhibit 2, the implied credit and liquidity risks as indicated by the historical three-year swap spreads for Country B were the lowest:
A. 1 month ago.
B. 6 months ago.
C. 12 months ago.
Liz Tyo is a fund manager for an actively managed global fixed-income fund that buys bonds issued in Countries A, B, and C. She and her assistant are preparing the quarterly markets update. Tyo begins the meeting by distributing the daily rates sheet, which includes the current government spot rates for Countries A, B, and C as shown in Exhibit 1.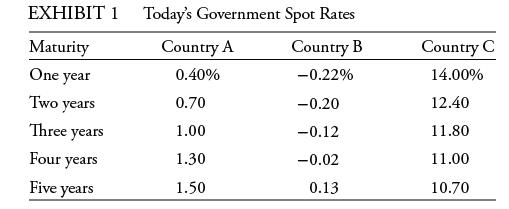
Tyo asks her assistant how these spot rates were obtained. The assistant replies, “Spot rates are determined through the process of bootstrapping. It entails backward substitution using par yields to solve for zero-coupon rates one by one, in order from latest to earliest maturities.”
Tyo then provides a review of the fund’s performance during the last year and comments, “The choice of an appropriate benchmark depends on the country’s characteristics. For example, although Countries A and B have both an active government bond market and a swap market, Country C’s private sector is much bigger than its public sector, and its government bond market lacks liquidity.”
Tyo further points out, “The fund’s results were mixed; returns did not benefit from taking on additional risk. We are especially monitoring the riskiness of the corporate bond holdings. For example, our largest holdings consist of three four-year corporate bonds (Bonds 1, 2, and 3) with identical maturities, coupon rates, and other contract terms. These bonds have Z-spreads of 0.55%, 1.52%, and 1.76%, respectively.”
Tyo continues, “We also look at risk in terms of the swap spread. We considered historical three-year swap spreads for Country B, which reflect that market’s credit and liquidity risks, at three different points in time.” Tyo provides the information in Exhibit 2.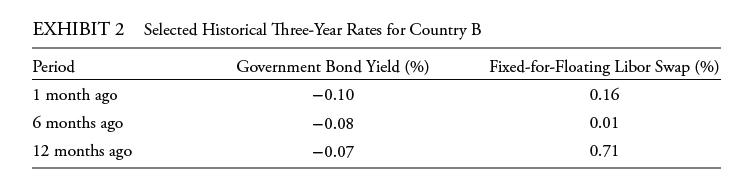
Tyo then suggests that the firm was able to add return by riding the yield curve. The fund plans to continue to use this strategy but only in markets with an attractive yield curve for this strategy.
She moves on to present her market views on the respective yield curves for a five-year investment horizon.
Country A: “The government yield curve has changed little in terms of its level and shape during the last few years, and I expect this trend to continue. We assume that future spot rates reflect the current forward curve for all maturities.”
Country B: “Because of recent economic trends, I expect a reversal in the slope of the current yield curve. We assume that future spot rates will be higher than current forward rates for all maturities.”
Country C: “To improve liquidity, Country C’s central bank is expected to intervene, leading to a reversal in the slope of the existing yield curve. We assume that future spot rates will be lower than today’s forward rates for all maturities.”
Tyo’s assistant asks, “Assuming investors require liquidity premiums, how can a yield curve slope downward? What does this imply about forward rates?”
Tyo answers, “Even if investors require compensation for holding longer-term bonds, the yield curve can slope downward—for example, if there is an expectation of severe deflation. Regarding forward rates, it can be helpful to understand yield curve dynamics by calculating implied forward rates. To see what I mean, we can use Exhibit 1 to calculate the forward rate for a two-year Country C loan beginning in three years.”
Step by Step Answer: