

The table below reports event day abnormal returns, standard deviations of the estimation window abnormal returns (i.e.,
Question:
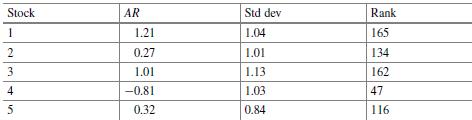
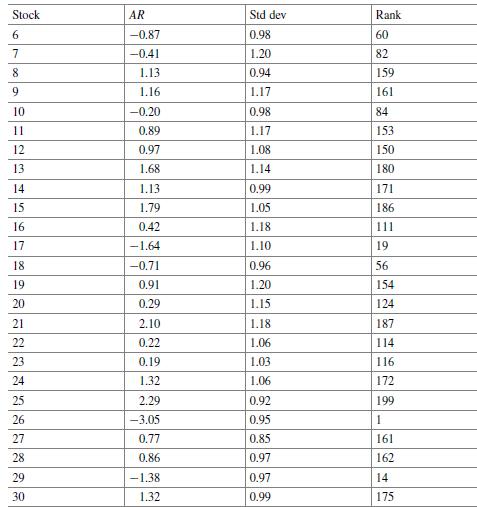
The table below reports event day abnormal returns, standard deviations of the estimation window abnormal returns (i.e., OLS residuals of the market model), and rank number of the event day abnormal return for each stock relative to its estimation window abnormal returns in a sample of n = 30 stocks. The estimation window is Te = 200 days so that T = Te + 1 (i.e., estimation window returns + event return) is the total number of returns for each stock.
The smallest return for each stock assumes rank number 1 and the largest 201.
Using this ranking approach, the rank number 164 for the first stock indicates that the event day abnormal return of 1. 21% is the 164th largest among the 201 returns from the combined estimation period and the event day. Test the null hypothesis of zero abnormal return using each of the following statistics:
a. tAR
b. zpatell
c. tbmp
d.∗ zsgn
e.∗ tgrank.
∗Optional: In the optional problem (d), assume that the dit = 1/Te in Eq. (A11.1). In optional problem (e), when computing Eq. (A11.4), you can use the theoretical standard error that in this case is:
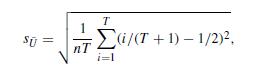
where T = Te +1 = 201. Using this equation, the result is s ¯U
= 0. 0524 (rounded to four decimal places).
Equation A11.1
![]()
Step by Step Answer:


Investment Valuation And Asset Pricing Models And Methods
ISBN: 9783031167836
1st Edition
Authors: James W. Kolari, Seppo Pynnönen
