

Figure P10-30 is a P-T diagram for the ethene + n-heptane system at 96.9% by mole ethene
Question:
Figure P10-30 is a P-T diagram for the ethene + n-heptane system at 96.9% by mole ethene (Kay, 1948). Please answer the following questions based on this figure. Note that the “•” in the figure describes the critical point for the mixture at this composition.
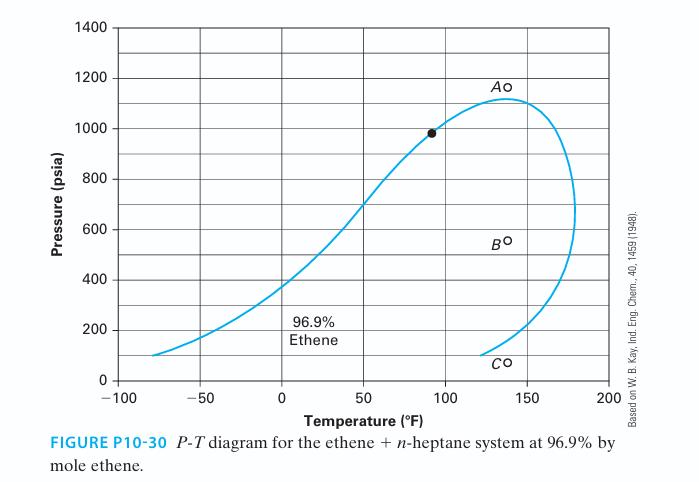
A. What is the curve to the left of the critical point called?
B. What is the curve to the right of the critical point called? Based on W. B. Kay, Ind. Eng. Chem., 40, 1459 (1948).
C. What is the percentage of liquid and vapor at point A?
D. What is the percentage of liquid and vapor at point C?
E. Would you expect point B to be 100% liquid, 100% vapor, or something in between?
F. Does the figure imply retrograde condensation? Please explain.
Step by Step Answer:


Fundamentals Of Chemical Engineering Thermodynamics
ISBN: 9781111580704
1st Edition
Authors: Kevin D. Dahm, Donald P. Visco
