

Compare the means and the standard deviations for the distribution of digits in Exercise 12.1 and the
Question:
Compare the means and the standard deviations for the distribution of digits in Exercise 12.1 and the sampling distribution of the mean in Exercise 12.2.
a) What would the Central Limit Theorem lead you to expect in this situation?
b) Do the data correspond to what you would predict?
Exercise 12.2
I drew 50 samples of five scores each from the same population that the data in Exercise 12.1 came from, and calculated the mean of each sample. The means are shown below. Plot the distribution of these means.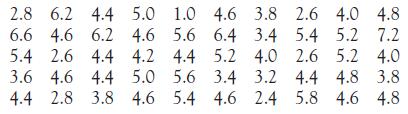
Exercise 12.1
The following numbers represent 100 random numbers drawn from a rectangular population with a mean of 4.5 and a standard deviation of 2.6. Plot the distribution of these digits.
(They are available as a text file in the data files on the Web.)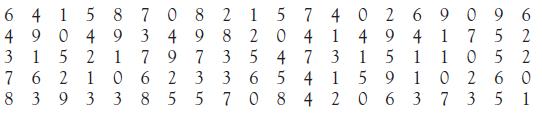
Step by Step Answer:
If you had drawn 50 samples of size 15 t...View the full answer


Fundamental Statistics For The Behavioral Sciences
ISBN: 9781305652972
9th Edition
Authors: David C. Howell
