

In Exercises 1 to 4, it may be helpful to draw a figure such as Figure 5.5.
Question:
In Exercises 1 to 4, it may be helpful to draw a figure such as Figure 5.5.
Figure 5.5.
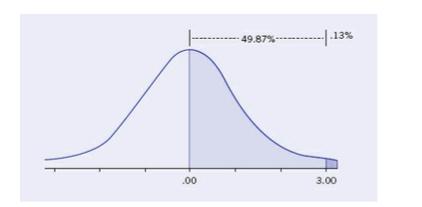
Using the normal curve table, determine the area of the standard normal distribution that is between the following \(z\)-scores:
a. \(z=.30\) and \(z=1.00\)
b. \(z=1.56\) and \(z=2.45\)
c. \(z=-.50\) and \(z=-.80\)
d. \(z=-.90\) and \(z=-2.67\)
e. \(z=-1.34\) and \(z=.10\)
f. \(z=-.75\) and \(z=.75\)
Step by Step Answer:

This question has not been answered yet.
You can Ask your question!
Related Book For 
Fundamental Statistics For The Social And Behavioral Sciences
ISBN: 9781483318790
1st Edition
Authors: Howard T. Tokunaga
Question Posted:
