

In Exercises 1 to 4, it may be helpful to draw a figure such as Figure 5.5.
Question:
In Exercises 1 to 4, it may be helpful to draw a figure such as Figure 5.5.
Figure 5.5.
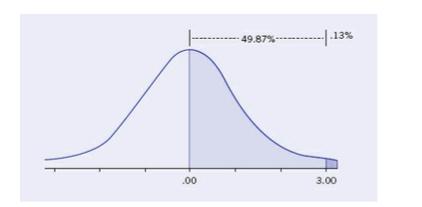
Using the normal curve table, determine the area of the standard normal distribution that is between the mean of 00 and the following \(z\)-scores:
a. \(z=.69\)
b. \(z=1.45\)
c. \(z=2.01\)
d. \(z=-.25\)
e. \(z=-1.86\)
Fantastic news! We've Found the answer you've been seeking!
Step by Step Answer:

Answered By
Charles mwangi
I am a postgraduate in chemistry (Industrial chemistry with management),with writing experience for more than 3 years.I have specialized in content development,questions,term papers and assignments.Majoring in chemistry,information science,management,human resource management,accounting,business law,marketing,psychology,excl expert ,education and engineering.I have tutored in other different platforms where my DNA includes three key aspects i.e,quality papers,timely and free from any academic malpractices.I frequently engage clients in each and every step to ensure quality service delivery.This is to ensure sustainability of the tutoring aspects as well as the credibility of the platform.
2+ Reviews
10+ Question Solved
Related Book For 
Fundamental Statistics For The Social And Behavioral Sciences
ISBN: 9781483318790
1st Edition
Authors: Howard T. Tokunaga
Question Posted:
