

The data relevant to Exercise 9.15 are the test scores and SAT-V scores for the 28 people
Question:
The data relevant to Exercise 9.15 are the test scores and SAT-V scores for the 28 people in the group that did not read the passage. These data are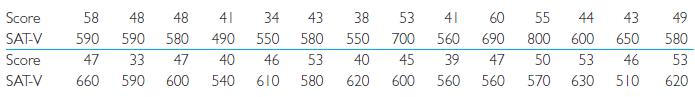
Exercise 9.15
In the study by Katz, et al., referred to previously, in which subjects answered questions about passages they had not read, the question arises as to whether there is a relationship between how the students performed on this test and how they had performed on the SAT-Verbal when they applied to college. Why is this a relevant question?
Interpret the results from Exercises 9.12–9.15.
Exercises 9.12–9.15
Why would you not feel comfortable computing a Pearson correlation on the data in Exercise 9.10?
Exercise 9.10
Down syndrome is another problem that psychologists deal with. It has been proposed that mothers who give birth at older ages are more likely to have a child with Down syndrome. Plot the data below relating age to incidence. The data were taken from Geyer (1991).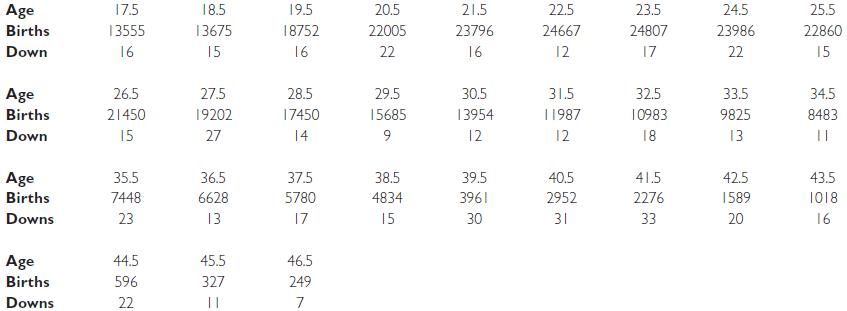
Plot a scatter diagram for the percentage of Down8 syndrome cases (Down / Births) as a function of age.
Exercise 9.13
One way to get around the problem you see in Exercise 9.12 would be to convert the incidence of Down syndrome to ranked data. Replot the data using ranked incidence and calculate the correlation. Is this a Spearman’s correlation?
Exercise 9.14
Do Exercise 9.13 using R. You can rank the data with ranked. data 5 rank(percent).
Exercise 9.15
In the study by Katz, et al., referred to previously, in which subjects answered questions about passages they had not read, the question arises as to whether there is a relationship between how the students performed on this test and how they had performed on the SAT-Verbal when they applied to college. Why is this a relevant question?
Step by Step Answer:

This question has not been answered yet.
You can Ask your question!

Fundamental Statistics For The Behavioral Sciences
ISBN: 9781305652972
9th Edition
Authors: David C. Howell
