

The frequency distribution on the following page represents the number of live births (in thousands) in the
Question:
The frequency distribution on the following page represents the number of live births (in thousands) in the United States in 2016 by age of mother.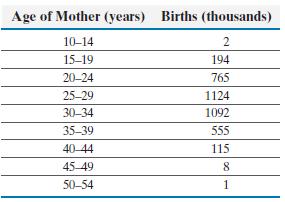
(a) Construct a relative frequency distribution.
(b) Construct a frequency histogram. Describe the shape of the distribution.
(c) Construct a relative frequency histogram.
(d) What percentage of live births were to mothers aged 20 to 24?
(e) What percentage of live births were to mothers of age 30 or older?
Fantastic news! We've Found the answer you've been seeking!
Step by Step Answer:
a Total births in thousands 2 194 765 1124 1092 555 115 8 1 3856 Relative freque...View the full answer

Answered By
Nazrin Ziad
I am a post graduate in Zoology with specialization in Entomology.I also have a Bachelor degree in Education.I posess more than 10 years of teaching as well as tutoring experience.I have done a project on histopathological analysis on alcohol treated liver of Albino Mice.
I can deal with every field under Biology from basic to advanced level.I can also guide you for your project works related to biological subjects other than tutoring.You can also seek my help for cracking competitive exams with biology as one of the subjects.
2+ Reviews
10+ Question Solved
Related Book For 

Question Posted:
