

The graph shows the ratings on Yelp for Hot Dougs Restaurant. (a) Which was the most popular
Question:
The graph shows the ratings on Yelp for Hot Doug’s Restaurant.
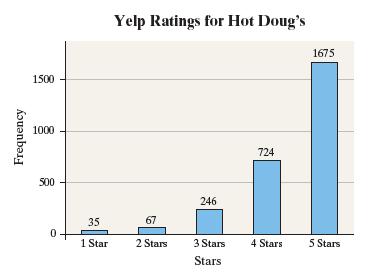
(a) Which was the most popular rating for Hot Doug’s?
(b) How many ratings were posted on Hot Doug’s?
(c) How many more 5 Star ratings are there than 4 Star ratings?
(d) What percentage of ratings are 5 Star ratings?
(e) Is it appropriate to describe the shape of the distribution as skewed left? Why or why not?
Fantastic news! We've Found the answer you've been seeking!
Step by Step Answer:
a A 5 Star rating was the most popular rating with 16...View the full answer

Answered By
YOGENDRA NAILWAL
As I'm a Ph.D. student, so I'm more focussed on my chemistry laboratory. I have qualified two national level exams viz, GATE, and NET JRF (Rank 68). So I'm highly qualified in chemistry subject. Also, I have two years of teaching experience in this subject, which includes college teacher as well as a personal tutor. I can assure you if you hire me on this particular subject, you are never going to regret it.
Best Regards.
1+ Reviews
10+ Question Solved
Related Book For 

Question Posted:
