

The results in Exercise 20.5 are not quite as clear-cut as we might like. Plot the differences
Question:
The results in Exercise 20.5 are not quite as clear-cut as we might like. Plot the differences as a function of the first-born’s score. What does this figure suggest?
I frequently ask you to use SPSS or R to solve a problem. You should have no problem with SPSS if you stick with the “Legacy” analyses. You should be able to use R by modifying the code that I give on the Web page for this chapter: http://www.uvm .edu/~dhowell/fundamentals9/Supplements/Chapter20R.html Exercise 20.5
It has been argued that first-born children tend to be more independent than later-born children.
Suppose we develop a 25-point scale of independence and rate each of 20 first-born children and their second-born siblings using our scale. We do this when both siblings are adults, thus eliminating obvious age effects. The data on independence are as follows (a higher score means that the person is more independent):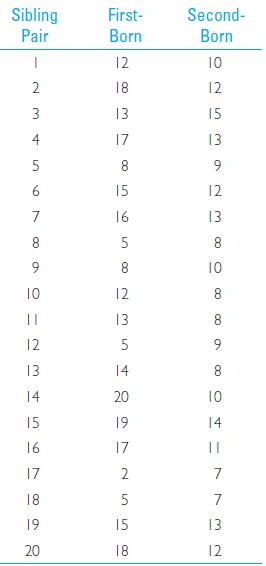
Step by Step Answer:
Data in Exercise 207 plotted as a function ...View the full answer


Fundamental Statistics For The Behavioral Sciences
ISBN: 9781305652972
9th Edition
Authors: David C. Howell
