

Using one of the online calculators, how large a correlation would you need for the relationships shown
Question:
Using one of the online calculators, how large a correlation would you need for the relationships shown in Exercise 9.2 to be significant? (This will involve a bit of trial and error.)
Calculate the correlations among all numeric variables in Exercise 9.1 using SPSS, or R.
(In R read in the data as a data.frame (e.g., theData) and then use (cor(theData). You don’t need to attach theData. You can also use plot(theData).)
Exercise 9.2
Calculate the correlations among all numeric variables in Exercise 9.1 using SPSS, or R.
(In R read in the data as a data.frame (e.g., theData) and then use (cor(theData). You don’t need to attach theData. You can also use plot(theData).)
Exercise 9.1
In Sub-Saharan Africa, more than half of mothers lose at least one child before the child’s first birthday. Below are data on 36 countries in the region, giving country, infant mortality, per capita income (in U.S. dollars), percentage of births to mothers under 20, percentage of births to mothers over 40, percentage of births less than two years apart, percentage of married women using contraception, and percentage of women with unmet family planning need.
(http://www.guttmacher.org/pubs/ib_2-02.html) Available at the book’s website as SubSaharanInfMort.
dat. (Notice the effect of outliers.)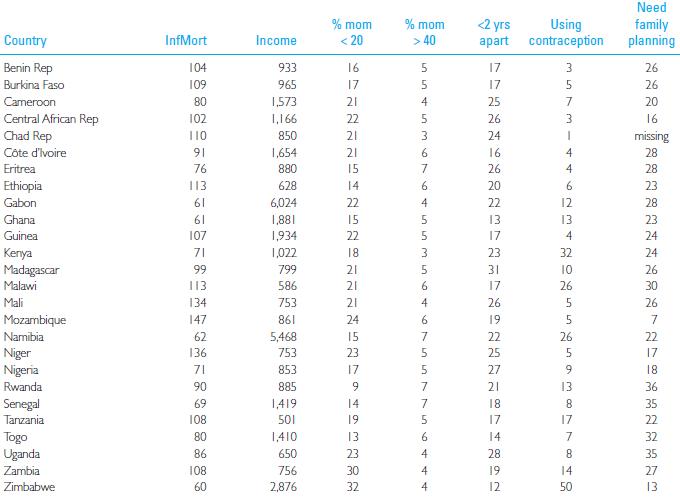
Step by Step Answer:
With 24 degrees ...View the full answer


Fundamental Statistics For The Behavioral Sciences
ISBN: 9781305652972
9th Edition
Authors: David C. Howell
