

An alternative to Figure 6-6 is to plot P against 1/V. The resulting graph is a straight
Question:
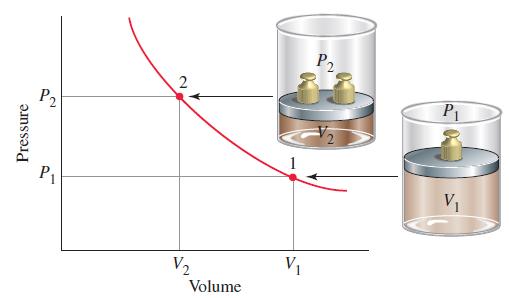
An alternative to Figure 6-6 is to plot P against 1/V. The resulting graph is a straight line passing through the origin. Use Boyle’s data from Feature Problem 125 to draw such a straight-line graph. What factors would affect the slope of this straight line? Explain.
Figure 6-6
Problem 125
Shown below is a diagram of Boyle’s original apparatus. At the start of the experiment, the length of the
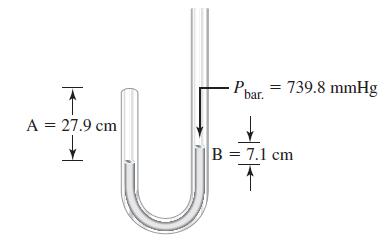
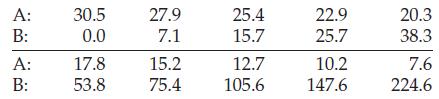
air column (A) on the left was 30.5 cm and the heights of mercury in the arms of the tube were equal. When mercury was added to the right arm of the tube, a difference in mercury levels (B) was produced, and the entrapped air on the left was compressed into a shorter length of the tube (smaller volume) as shown in the illustration cm for A = 27.9 and B = 7.1 cm. Boyle’s values of A and B, in centimeters, are listed as follows:
Step by Step Answer:

This question has not been answered yet.
You can Ask your question!


General Chemistry Principles And Modern Applications
ISBN: 9780132931281
11th Edition
Authors: Ralph Petrucci, Jeffry Madura, F. Herring, Carey Bissonnette
