

Plot a graph to show the variation in values of IE 1 , IE 2 and IE
Question:
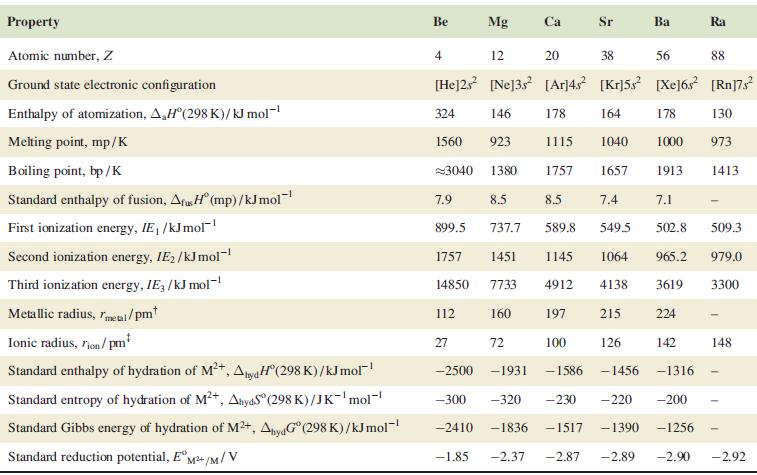
Plot a graph to show the variation in values of IE1, IE2 and IE3 for the group 13 elements (Table 13.1), and plot a similar graph to show the variation in values of IE1 and IE2 for the group 2 metals (Table 12.1). Account for differences in trends of IE2 for the group 2 and 13 elements.
Table 13.1
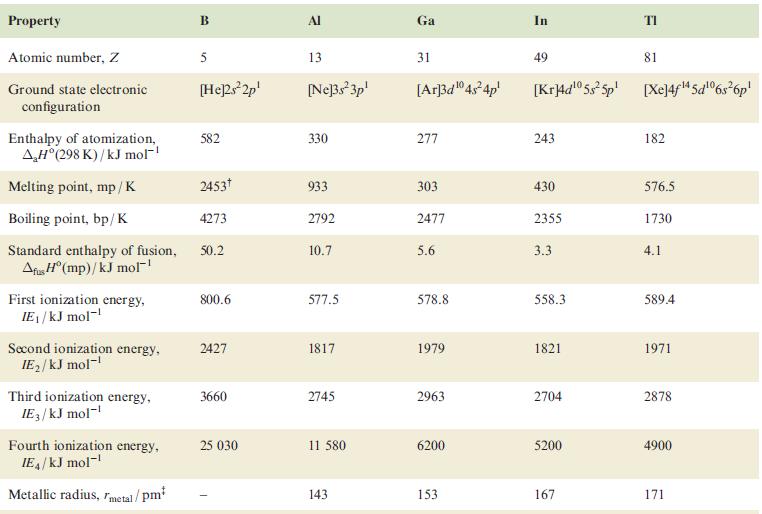
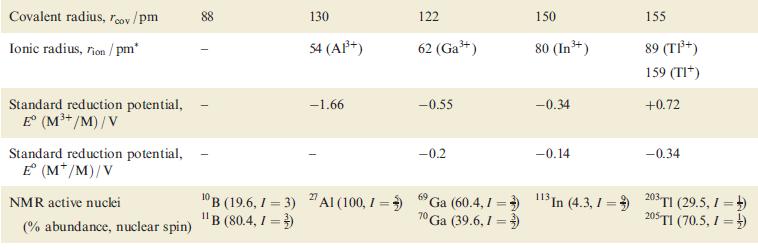
Table 12.1.
Fantastic news! We've Found the answer you've been seeking!
Step by Step Answer:
python import matplotlibpyplot as plt Data from Table 131 for Group 13 elements elementsgroup13 B Al Ga In Tl IE1group13 8006 5775 5788 5583 5894 IE2group13 2427 1817 1979 1821 1971 IE3group13 3660 27...View the full answer

Answered By
Utsab mitra
I have the expertise to deliver these subjects to college and higher-level students. The services would involve only solving assignments, homework help, and others.
I have experience in delivering these subjects for the last 6 years on a freelancing basis in different companies around the globe. I am CMA certified and CGMA UK. I have professional experience of 18 years in the industry involved in the manufacturing company and IT implementation experience of over 12 years.
I have delivered this help to students effortlessly, which is essential to give the students a good grade in their studies.
2+ Reviews
10+ Question Solved
Related Book For 

Question Posted:
