

Starting with Fig. 20.12, show how, using a crystal-field approach, an extreme tetragonal distortion leads to the
Question:
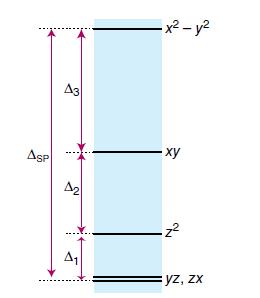
Starting with Fig. 20.12, show how, using a crystal-field approach, an extreme tetragonal distortion leads to the orbital energy-level diagram in Fig. 20.10. Perform a similar analysis for two-coordinate linear complexes.
Figure 20.12.
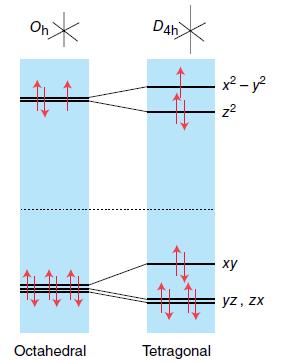
Figure 20.10.
Fantastic news! We've Found the answer you've been seeking!
Step by Step Answer:
1 Octahedral Field Oh In an octahedral crystal field the dorbitals split into two groups due to the electrostatic interactions between the ligands and ...View the full answer

Answered By
Somshukla Chakraborty
I have a teaching experience of more than 4 years by now in diverse subjects like History,Geography,Political Science,Sociology,Business Enterprise,Economics,Environmental Management etc.I teach students from classes 9-12 and undergraduate students.I boards I handle are IB,IGCSE, state boards,ICSE, CBSE.I am passionate about teaching.Full satisfaction of the students is my main goal.
I have completed my graduation and master's in history from Jadavpur University Kolkata,India in 2012 and I have completed my B.Ed from the same University in 2013. I have taught in a reputed school of Kolkata (subjects-History,Geography,Civics,Political Science) from 2014-2016.I worked as a guest lecturer of history in a college of Kolkata for 2 years teaching students of 1st ,2nd and 3rd year. I taught Ancient and Modern Indian history there.I have taught in another school in Mohali,Punjab teaching students from classes 9-12.Presently I am working as an online tutor with concept tutors,Bangalore,India(Carve Niche Pvt.Ltd.) for the last 1year and also have been appointed as an online history tutor by Course Hero(California,U.S) and Vidyalai.com(Chennai,India).
2+ Reviews
10+ Question Solved
Related Book For 

Inorganic Chemistry
ISBN: 9780198768128
7th Edition
Authors: Mark Weller, Tina Overton, Jonathan Rourke
Question Posted:
