

In your answer to this question, use a diagram like Figure 4.3, making it large enough so
Question:
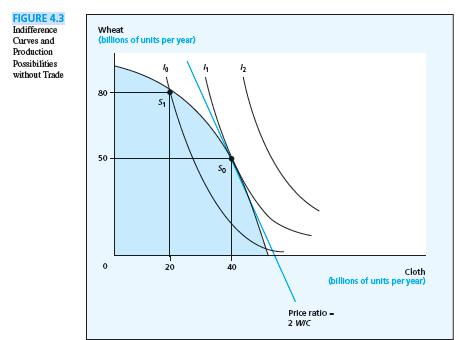
In your answer to this question, use a diagram like Figure 4.3, making it large enough so that you can see the curves and quantities clearly. The no-trade point is as shown in Figure 4.3, a price ratio of 2 W / C and 40 units of cloth demanded. Sketch the derivation of the portion of the country’s cloth demand curve for cloth prices of 2 and below.
(To do this, examine a price of about 1.5, then 1.0, and then 0.5. In your analysis you will need to show additional community indifference curves—ones that exist but are not shown explicitly in Figure 4.3.)
Data From Figure 4.3
Fantastic news! We've Found the answer you've been seeking!
Step by Step Answer:
Refer to the graphs below To derive the countrys cloth demand curve we need to ...View the full answer

Answered By
Susan Juma
I'm available and reachable 24/7. I have high experience in helping students with their assignments, proposals, and dissertations. Most importantly, I'm a professional accountant and I can handle all kinds of accounting and finance problems.
15+ Reviews
45+ Question Solved
Related Book For 

Question Posted:
