

Here are the same data as in Exercise 5 but displayed differently: a) Describe what this plot
Question:
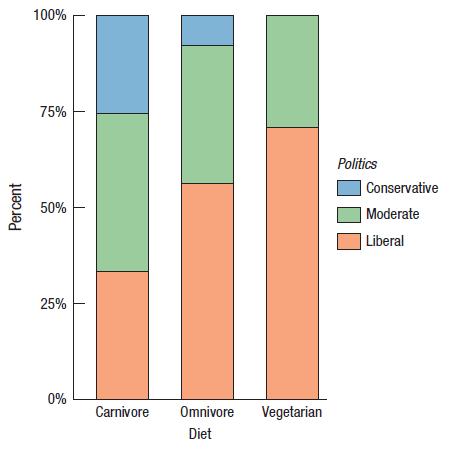
Here are the same data as in Exercise 5 but displayed differently:

a) Describe what this plot shows using the concept of a conditional distribution.
b) Do you think the differences here are real? Explain.
Data From Exercise 5
The survey of 299 undergraduate students from Exercise 86 in Chapter 2 (data in Student Survey) asked about respondents’ diet preference (Carnivore, Omnivore, Vegetarian) and political alignment (Liberal, Moderate, Conservative). Here is a stacked bar chart of the 285 responses:
Fantastic news! We've Found the answer you've been seeking!
Step by Step Answer:
a The distribution of diet preference among liberals is approximately 10 carnivore 75 om...View the full answer

Answered By
Navashree Ghosh
I believe in quality work and customer satisfaction. So, I can assure you that you will get quality work from me when you hire me. Let's work together and build a long-term association.
82+ Reviews
116+ Question Solved
Related Book For 

Intro Stats
ISBN: 9780134668420
5th Edition
Authors: Richard D De Veaux, Paul F Velleman, David E Bock, Nick Horton
Question Posted:
