

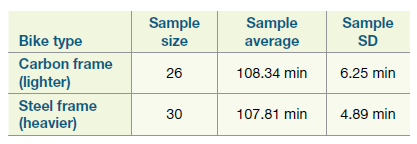
Recall Example 6.2 about the bike commuting times. On each of 56 days (from mid-January to mid-July
Question:
In Example 6.2 you read about conducting a randomization based test to investigate whether the average commute time differs by bike type.
a. Suppose we suspect that the lighter carbon frame bike will be less stable, especially in inclement weather conditions, and will have a higher variability in commute times, compared to the heavier steel frame bike. Is there any indication from the data in support of this suspicion? Explain how you are deciding. To investigate whether the variability in commute times will be higher with the lighter carbon frame bike than the heavier steel frame one, we can examine the ratio of the SDs, such that Ratio = SDcarbon ÷ SDsteel. (Note: ÷ is €œdivided by.€)
b. In theory, what numeric values can this ratio take?
c. For the observed data, what is the numeric value of the statistic Ratio?
d. Describe in detail how you would use simulation (with pennies, dice, spinners, cards, etc.) to find a p-value to test whether the variability in commute times is higher with the lighter carbon frame bike than the heavier steel frame one. Here is a histogram from an appropriately conducted simulation:
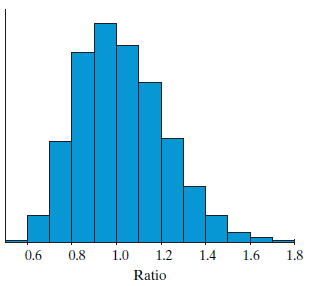
e. As per the above histogram, what numeric values are most common for Ratio from the simulation? Why does that make sense?
f. Indicate, on the above histogram, the region that depicts the p-value in the context of the study, being sure to include appropriate numbers.
g. Which of the following appears to be the approximate p-value? No explanations needed. Choose one.
A. 1.00
B. 0.10
C. 0.01
D. < 0.01
h. Which of the following is an appropriate statement to make based on the above histogram? Circle one.
A. There is not convincing evidence of the variability in commute times being higher with the lighter carbon frame bike than the heavier steel frame one because the distribution of Ratio is not centered at 0.
B. There is some evidence of the variability in commute times being higher with the lighter carbon frame bike than the heavier steel frame one because the distribution of Ratio is centered not at 0 but at 1.
C. There is not convincing evidence of the variability in commute times being higher with the lighter carbon frame bike than the heavier steel frame one because the distribution of Ratio is not normal but skewed right.
D. None of the above.
The word "distribution" has several meanings in the financial world, most of them pertaining to the payment of assets from a fund, account, or individual security to an investor or beneficiary. Retirement account distributions are among the most...
Step by Step Answer:
a Yes the SD for carbon is higher b Any value betwe...View the full answer


Introduction To Statistical Investigations
ISBN: 9781118172148
1st Edition
Authors: Beth L.Chance, George W.Cobb, Allan J.Rossman Nathan Tintle, Todd Swanson Soma Roy
