

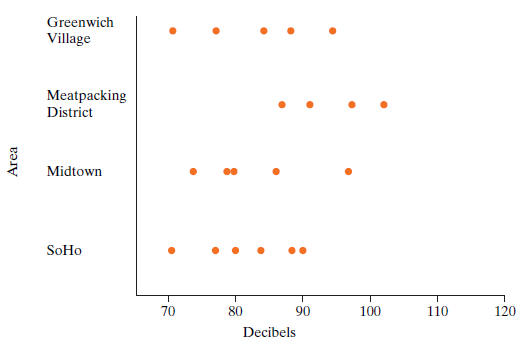
Recorded noise levels in decibels for a sample of locations in four different parts of New York
Question:
a. What is the observational unit? What is the response variable? What is the explanatory variable?
b. Which of the following best describes the pattern in the plot? (Choose one.)
A. Within-group variability is roughly constant (roughly the same in in each group) and group means are roughly equal. A theory-based test is appropriate, but the p-value will not be significant. (Th e evidence of a difference in means is weak.)
B. Within-group variability is roughly constant (roughly the same in each group) but at least one group mean differs substantially from the others. A theory-based test is appropriate and the p-value may be significant.
C. The pattern in the plot indicates that the theory-based F-test is not appropriate. A simulation test should be done instead.
D. None of the above.
c. Discuss the scope of inference in the context of the following facts about the study: All six of the SoHo locations were inside stores. None of the other 14 locations were. All of the locations in the Meatpacking District and four of the five locations in the Village were in restaurants. Three of the five Midtown locations were in restaurants. In the study, restaurants tended to be noisy, especially later in the evening. Stores tended to be quiet.
Step by Step Answer:
a The observational unit is a location The response is the noise level i...View the full answer


Introduction To Statistical Investigations
ISBN: 9781118172148
1st Edition
Authors: Beth L.Chance, George W.Cobb, Allan J.Rossman Nathan Tintle, Todd Swanson Soma Roy
