

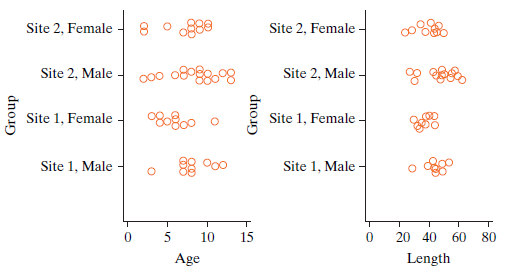
The two plots below show distributions of age (left panel) and length (right panel) for male and
Question:
a. Classify each of the following statements as True or False:
A. The observational unit is the same for both plots.
B. The response variable is the same for both plots.
C. The explanatory variable is the same for both plots.
b. Compare the two plots for age (left ) and length (right). For each plot, eyeball the differences between groups and the variability within groups. Which plot age
or length shows the stronger evidence of differences between groups?
c. Now focus on age (left plot). Here are the group averages:
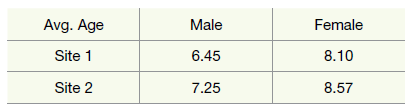
Consider two comparisons, site and sex:
Site: Site 1 (Groups 1 & 2) versus Site 2 (Groups 3 & 4)
Sex: male (Groups 1 & 3) versus female (Groups 2 & 4)
Which average difference is larger?
d. Now compare all four groups at once. Without computing all the pairwise differences, estimate the mean absolute pairwise difference in age to the nearest 5 years. Choose from 0, 5, 10, 15, €¦ .
e. Consider the p-values 0.023 and 0.230. They differ by a factor of 10. One is approximately correct, based on a simulation using 10,000 repetitions, for comparing mean age across the four groups. The other is badly wrong. Which one is correct: 0.023 or 0.23?
f. Now change your focus from age to length (right panel). Here are the group averages ordered from smallest to largest: 37.50, 40.10, 43.70, 49.50. Use the plot to match each average to its group.
g. On average, which has the longer snakes, Site 1 or Site 2? On average, which snakes are longer, males or females?
h. Now compare all four groups at once. Without computing all pairwise differences, estimate the mean absolute pairwise difference in length to the nearest half foot (6 inches). (Choose from 0, 6, 12, 18, €¦) See the hint in part (d) above.
i. Consider the p-values 0.0005, 0.20, and 0.50. One is approximately correct, using a theory-based F-test. The other two are wrong. Which one is correct?
j. Suppose we had measured the age of the rattlesnakes in months rather than years: 1 year = 12 months, 2 years = 24 months, etc. Several quantities are listed below. For each one, choose one of:
A. The quantity won€™t change.1
B. The quantity will be multiplied by 12.
C. The quantity will change but the multiplier will not be 12.
D. It€™s impossible to tell.
i. The mean age for each group
ii. The mean absolute pairwise difference
iii. The p-value based on the mean absolute pairwise difference
iv. The mean square for groups (between groups)
v. The mean square within groups
vi. The F-statistic
vii. The p-value based on the F-statistic
Step by Step Answer:
a TrueFalse A True The observational unit is the same the snake for both plots B False Th e response ...View the full answer


Introduction To Statistical Investigations
ISBN: 9781118172148
1st Edition
Authors: Beth L.Chance, George W.Cobb, Allan J.Rossman Nathan Tintle, Todd Swanson Soma Roy
