

The data shown in the following scatterplot show a very nice relationship between the two variables. However,
Question:
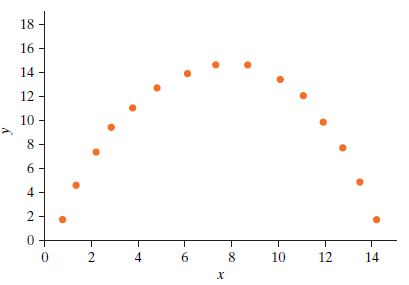
The data shown in the following scatterplot show a very nice relationship between the two variables. However, the correlation here is 0.03, very close to zero. Explain why we can have a nice relationship between two quantitative variables and yet have a correlation of 0.
Fantastic news! We've Found the answer you've been seeking!
Step by Step Answer:
The correlation coefficient measures the strength of the linear rela...View the full answer

Answered By
ANDREW KIPRUTO
Academic Writing Expert
I have over 7 years of research and application experience. I am trained and licensed to provide expertise in IT information, computer sciences related topics and other units like chemistry, Business, law, biology, biochemistry, and genetics. I'm a network and IT admin with +8 years of experience in all kind of environments.
I can help you in the following areas:
Networking
- Ethernet, Wireless Airmax and 802.11, fiber networks on GPON/GEPON and WDM
- Protocols and IP Services: VLANs, LACP, ACLs, VPNs, OSPF, BGP, RADIUS, PPPoE, DNS, Proxies, SNMP
- Vendors: MikroTik, Ubiquiti, Cisco, Juniper, HP, Dell, DrayTek, SMC, Zyxel, Furukawa Electric, and many more
- Monitoring Systems: PRTG, Zabbix, Whatsup Gold, TheDude, RRDtoo
Always available for new projects! Contact me for any inquiries
1+ Reviews
10+ Question Solved
Related Book For 

Introduction To Statistical Investigations
ISBN: 9781118172148
1st Edition
Authors: Beth L.Chance, George W.Cobb, Allan J.Rossman Nathan Tintle, Todd Swanson Soma Roy
Question Posted:
