

The following data represent x = the total number of businesses and y = the number of
Question:
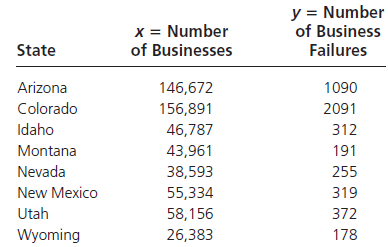
a. Draw a scatter diagram representing these data.
b. Using the €œeyeball€ method, fit a straight line to the data.
c. Does there appear to be any relationship between the variables? If so, is the relationship direct or inverse?
Fantastic news! We've Found the answer you've been seeking!
Step by Step Answer:
We can use Excel to plot the data for us As can be seen from the graph there does appear ...View the full answer

Answered By
Shem Ongek
I am a professional who has the highest levels of self-motivation. Additionally, I am always angled at ensuring that my clients get the best of the quality work possible within the deadline. Additionally, I write high quality business papers, generate quality feedback with more focus being on the accounting analysis. I additionally have helped various students here in the past with their research papers which made them move from the C grade to an A-grade. You can trust me 100% with your work and for sure I will handle your papers as if it were my assignment. That is the kind of professionalism that I swore to operate within. I think when rating the quality of my work, 98% of the students I work for always come back with more work which therefore makes me to be just the right person to handle your paper.
174+ Reviews
426+ Question Solved
Related Book For 

Question Posted:
