

The following scatterplot represents scores on Test 2 and Test 3 in Introductory Statistics for a random
Question:
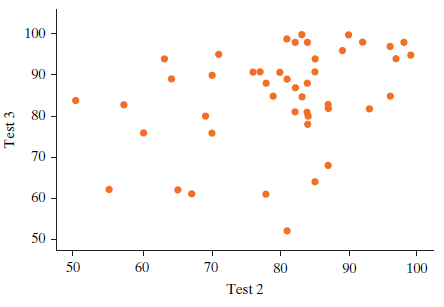
The regression equation for these data is ŷ = 55.2 + 0.3708x, where x is the score on Test 2 and yˆ is the expected score on Test 3. The mean for Test 2 was 79.80 and the mean for Test 3 was 84.80.
a. In the accompanying scatterplot, there appears to be a positive relationship between scores on Test 2 and Test 3. Does this mean that a person who scores above the mean on Test 2 is expected to also score above the mean on Test 3? What about those who score below the mean on Test 2: Are they expected to score below the mean on Test 3?
b. If a student scores 79.80 on Test 2, what is their predicted score for Test 3? If that student then actually gets 90 on Test 3, what is the residual?
c. If someone scores 10 points above the mean on Test 2, how many points above the mean on Test 3 is their expected score?
d. If someone scores 10 points below the mean on Test 2, how many points below the mean on Test 3 is their expected score?
Step by Step Answer:
a The answer to both questions is yes The least squares line ...View the full answer


Introduction To Statistical Investigations
ISBN: 9781118172148
1st Edition
Authors: Beth L.Chance, George W.Cobb, Allan J.Rossman Nathan Tintle, Todd Swanson Soma Roy
