

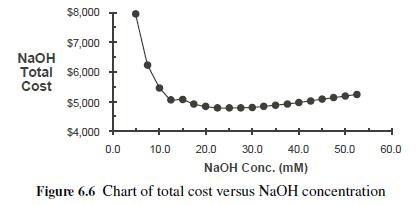
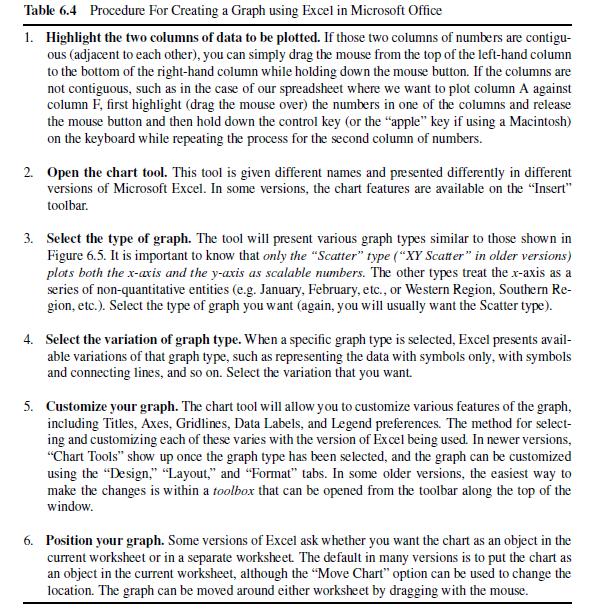
Produce the chart in Figure 6.6 by following the appropriate steps (e.g., those in Table 6.4). $8,000
Question:
Produce the chart in Figure 6.6 by following the appropriate steps (e.g., those in Table 6.4).
Step by Step Answer:

This question has not been answered yet.
You can Ask your question!
Related Book For 
Introduction To Chemical Engineering Tools For Today And Tomorrow
ISBN: 9780470885727
5th Edition
Authors: Kenneth A. Solen, John N. Harb
Question Posted:
