

In Ex. 15.8, Henrys constant for adsorption k, identified as the intercept on a plot of nP
Question:
In Ex. 15.8, Henry’s constant for adsorption k, identified as the intercept on a plot of n∕P vs. n, was found from a polynomial curve-fit of n∕P vs. n. An alternative procedure is based on a plot of ln(P∕n) vs. n. Suppose that the adsorbate equation of state is a power series in n: z = 1 + Bn + Cn2 + . . . . Show how from a plot (or a polynomial curve-fit) of ln(P∕n) vs. n one can extract values of k and B.
Ex. 15.8
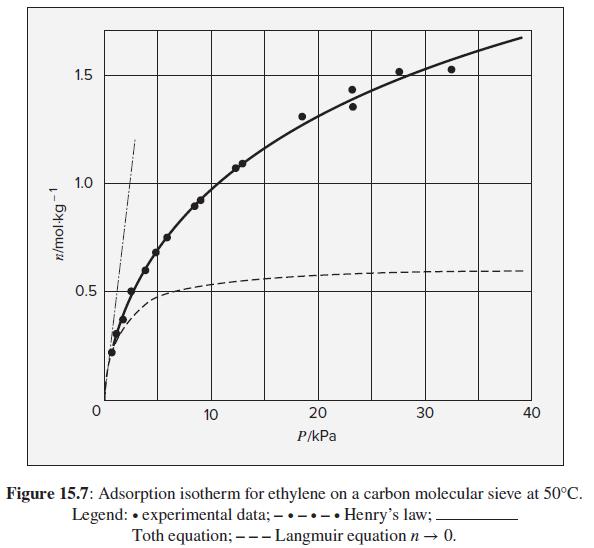
Nakahara et al.11 report data for ethylene adsorbed on a carbon molecular sieve ( A = 650 m2 ·g−1) at 50°C. The data, shown as filled circles in Fig. 15.7, consist of pairs of values (P, n), where P is the equilibrium gas pressure in kPa and n is moles of adsorbate per kg of adsorbent. Trends shown by the data are typical for physical adsorption on a heterogeneous adsorbent at low-to-moderate surface coverage. Use these data to illustrate numerically the concepts developed for pure-gas adsorption.
Fig. 15.7
Step by Step Answer:
To extract values of Henrys constant k and the coefficient B from a plot of lnP vs n we ca...View the full answer


Introduction To Chemical Engineering Thermodynamics
ISBN: 9781259696527
8th Edition
Authors: J.M. Smith, Hendrick Van Ness, Michael Abbott, Mark Swihart
