

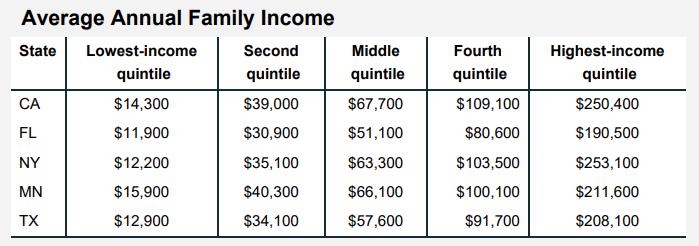
The accompanying table contains data on the income distribution of five states. Pick one and sketch out
Question:
The accompanying table contains data on the income distribution of five states. Pick one and sketch out its income distribution similar to Figure 1. What percentage of all income does the highest-income quintile earn? Using what you learned in the text, if current trends continue, how do you expect the share of income going to the highest-income quintile to change in the next 20 years?
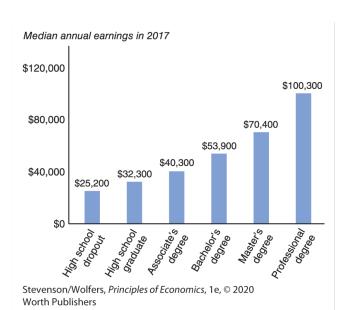
Figure 1
Fantastic news! We've Found the answer you've been seeking!
Step by Step Answer:
I created a bar chart similar to Figure 1 representing the income distribution for the ...View the full answer

Answered By
David Muchemi
I am a professional academic writer with considerable experience in writing business and economic related papers. I have been writing for my clients who reach out to me personally after being recommended to me by satisfied clients.
I have the English language prowess, no grammatical and spelling errors can be found in my work. I double-check for such mistakes before submitting my papers.
I deliver finished work within the stipulated time and without fail. I am a good researcher on any topic especially those perceived to be tough.
I am ready to work on your papers and ensure you receive the highest quality you are looking for. Please hire me to offer my readily available quality service.
Best regards,
27+ Reviews
61+ Question Solved
Related Book For 

Question Posted:
