

Ts diagrams for two reversible thermodynamic power cycles are shown in the following fi gure. Both cycles
Question:
Ts diagrams for two reversible thermodynamic power cycles are shown in the following fi gure.
Both cycles operate between a high temperature reservoir at 500 K and a low temperature reservoir at 300 K. The process on the left is the Carnot cycle described in Section 2.9. The process on the right is a Stirling cycle, which is similar to a Carnot cycle, except that the two steps (state 4 to state 1)
and (state 2 to state 3) are at constant volume. Which cycle, if either, has a greater effi ciency? Explain.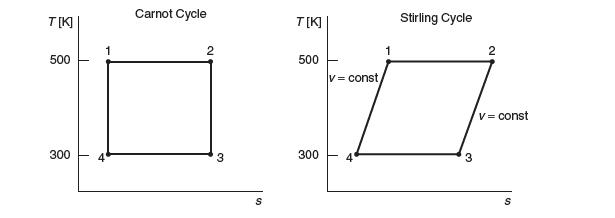
Fantastic news! We've Found the answer you've been seeking!
Step by Step Answer:

Answered By
PALASH JHANWAR
I am a Chartered Accountant with AIR 45 in CA - IPCC. I am a Merit Holder ( B.Com ). The following is my educational details.
PLEASE ACCESS MY RESUME FROM THE FOLLOWING LINK: https://drive.google.com/file/d/1hYR1uch-ff6MRC_cDB07K6VqY9kQ3SFL/view?usp=sharing
3+ Reviews
10+ Question Solved
Related Book For 
Question Posted:
