

Examine the bottom graph on page 462 showing solubility in water as a function of temperature. What
Question:
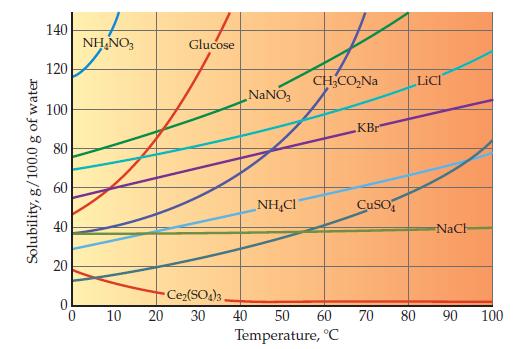
Examine the bottom graph on page 462 showing solubility in water as a function of temperature. What is the trend for most of the ionic substances shown?
Data from Graph page 462
Fantastic news! We've Found the answer you've been seeking!
Step by Step Answer:
The trend for most of the ionic substances shown in the bottom graph on page 462 is that their solub...View the full answer

Answered By
Utsab mitra
I have the expertise to deliver these subjects to college and higher-level students. The services would involve only solving assignments, homework help, and others.
I have experience in delivering these subjects for the last 6 years on a freelancing basis in different companies around the globe. I am CMA certified and CGMA UK. I have professional experience of 18 years in the industry involved in the manufacturing company and IT implementation experience of over 12 years.
I have delivered this help to students effortlessly, which is essential to give the students a good grade in their studies.
2+ Reviews
10+ Question Solved
Related Book For 

Introductory Chemistry Atoms First
ISBN: 9780321927118
5th Edition
Authors: Steve Russo And Michael Silver
Question Posted:
