

The following plot traces the concentrations over time for the reactant and product in the equilibrium reaction
Question:
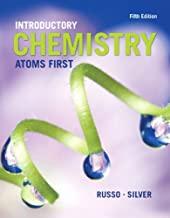
The following plot traces the concentrations over time for the reactant and product in the equilibrium reaction N2O4(g) ⇆ 2NO2(g). At approximately what time into the reaction has equilibrium occurred? Explain why you chose that time.
![Concentration [NO] [NO] 0 1 2 3 4 5 6 7 8 9 10 11 12 13 Minutes](https://dsd5zvtm8ll6.cloudfront.net/images/question_images/1701/9/3/3/3736571713d4eb6b1701933373265.jpg)
Fantastic news! We've Found the answer you've been seeking!
Step by Step Answer:
Based on the given plot it appears that equilibrium has occurred at ...View the full answer

Answered By
Deborah Joseph
My experience has a tutor has helped me with learning and relearning. You learn everyday actually and there are changes that are made to the curriculum every time so being a tutor has helped in keeping me updated about the present curriculum and all.
I have also been able to help over 100 students achieve better grades particularly in the categories of Math and Biology both in their internal examinations and external examinations.
2+ Reviews
10+ Question Solved
Related Book For 
Introductory Chemistry Atoms First
ISBN: 9780321927118
5th Edition
Authors: Steve Russo And Michael Silver
Question Posted:
