

In Example 16.14, we described an ordinal probit model for postsecondary education choice, and estimated a simple
Question:
In Example 16.14, we described an ordinal probit model for postsecondary education choice, and estimated a simple model in which the choice depended simply on the student's GRADES. Expand the ordered probit model to include family income (FAMINC, in \(\$ 1000\) ), family size (FAMSIZ), the dummy variables \(B L A C K\) and \(P A R C O L L=1\) if a parent has at least a college degree, and 0 otherwise. The estimates of this model are Model 2 in Table 16.13.
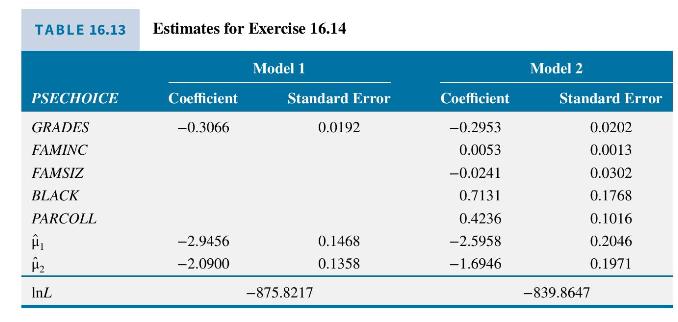
a. Using the estimates in Table 16.13, Model 1, calculate the probability that a student will choose no college, a 2-year college, and a 4-year college if the student's grades are GRADES \(=7(\mathrm{~B}-)\). Recompute these probabilities assuming that \(G R A D E S=3(\mathrm{~A}-)\). Discuss the probability changes. Are they what you anticipated? Explain.
b. Discuss the Model 2 estimates, their signs and significance.
c. Test the joint significance of the variables added in (b) using a likelihood ratio test at the \(1 \%\) level of significance.
d. Compute the probability that a black student from a household of four members with \(\$ 100,000\) income, and with at least one parent having at least a college degree, so that PARCOLL \(=1\), will attend a 4-year college if (i) GRADES \(=7\) and (ii) GRADES \(=3\).
e. Repeat (d) for a "nonblack" student and discuss the differences in your findings.
Data From Example 16.14:-
To illustrate, we use the college choice data introduced in Section 16.3 and contained in the data file nels_small. We treat PSECHOICE as an ordered variable with 1 representing the least favored alternative (no college) and 3 denoting the most favored alternative (4-year college). The estimation results are in Table 16.5 .
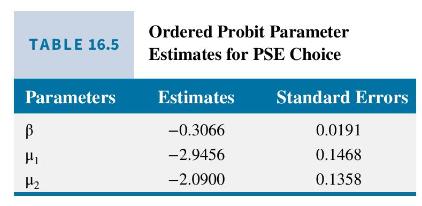
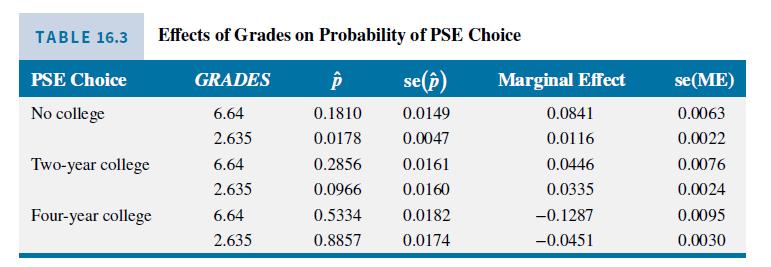
The estimated coefficient of GRADES is negative, indicating that the probability of attending a 4-year college goes down when GRADES increase (indicating a worse performance), and the probability of the lowest ranked choice, attending no college, increases. Let us examine the marginal effects of an increase in GRADES on attending a 4-year college. For a student with median grades (6.64), the marginal effect is -0.1221 , and for a student in the 5th percentile (2.635), the marginal effect is -0.0538 . These are similar in magnitude to the marginal effects shown in Table 16.3.
Data From Table 16.3:-
Step by Step Answer:


Principles Of Econometrics
ISBN: 9781118452271
5th Edition
Authors: R Carter Hill, William E Griffiths, Guay C Lim
