

a. The following figure shows hypothetical data for a group of children. By looking at the figure,
Question:
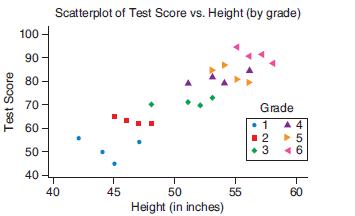
a. The following figure shows hypothetical data for a group of children. By looking at the figure, state whether the correlation between height and test score is positive, negative, or near zero.
b. The shape and color of the each marker show what grade these children were in at the time they took the test. Look at the six different groupings (for grades 1, 2, 3, 4, 5, and 6) and decide whether the correlation (the answer to part [a]) would stay the same if you controlled for grade (that is, if you looked only within specific grades).
c. Suppose a school principal looked at this scatterplot and said, “This means that taller students get better test scores, so we should give more assistance to shorter students.” Do the data support this conclusion? Explain. If yes, say why. If no, give another cause for the association.
Step by Step Answer:
a Based on the scatterplot provided we can observe a pattern that suggests there is a positive correlation between height and test score for the group ...View the full answer


Introductory Statistics Exploring The World Through Data
ISBN: 9780135163146
3rd Edition
Authors: Robert Gould, Rebecca Wong, Colleen N. Ryan
