

One histogram shows the distribution of costs for all used Toyota Sienna vans for sale within a
Question:
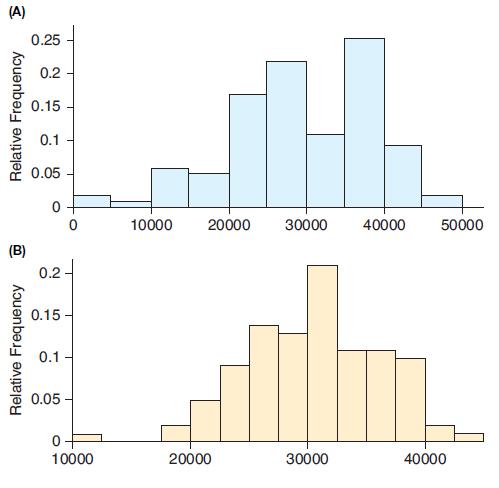
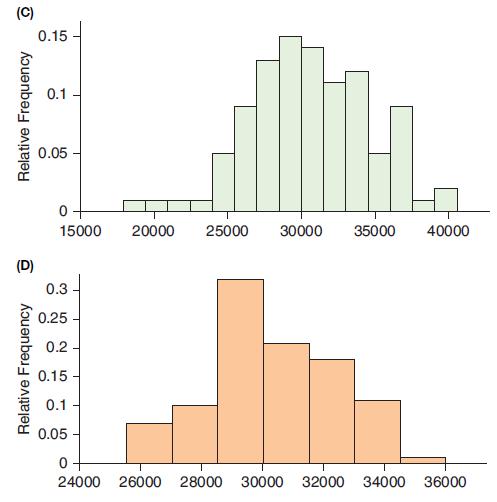
One histogram shows the distribution of costs for all used Toyota Sienna vans for sale within a 100 mile radius of San Leandro, CA, for a day in 2018. The other three graphs show distributions of means from random samples taken from this population based on samples of 2 vans, 5 vans, and 15 vans. Each graph based on means was done with many repetitions. Which distribution is which, and why?
Fantastic news! We've Found the answer you've been seeking!
Step by Step Answer:
The histogram is the distribution of costs for all used Toyota Sienna vans for sale ...View the full answer

Answered By
James Warinda
Hi! I’m James Otieno and I'm an experienced professional online tutor with countless hours of success in tutoring many subjects in different disciplines. Specifically, I have handled general management and general business as a tutor in Chegg, Help in Homework and Trans tutor accounts.
I believe that my experience has made me the perfect tutor for students of all ages, so I'm confident I can help you too with finding the solution to your problems. In addition, my approach is compatible with most educational methods and philosophies which means it will be easy for you to find a way in which we can work on things together. In addition, my long experience in the educational field has allowed me to develop a unique approach that is both productive and enjoyable.
I have tutored in course hero for quite some time and was among the top tutors awarded having high helpful rates and reviews. In addition, I have also been lucky enough to be nominated a finalist for the 2nd annual course hero award and the best tutor of the month in may 2022.
I will make sure that any student of yours will have an amazing time at learning with me, because I really care about helping people achieve their goals so if you don't have any worries or concerns whatsoever you should place your trust on me and let me help you get every single thing that you're looking for and more.
In my experience, I have observed that students tend to reach their potential in academics very easily when they are tutored by someone who is extremely dedicated to their academic career not just as a businessman but as a human being in general.
I have successfully tutored many students from different grades and from all sorts of backgrounds, so I'm confident I can help anyone find the solution to their problems and achieve
0 Reviews
10+ Question Solved
Related Book For 

Introductory Statistics Exploring The World Through Data
ISBN: 9780135163146
3rd Edition
Authors: Robert Gould, Rebecca Wong, Colleen N. Ryan
Question Posted:
