

Combining information from the S&P reports and some estimated data for 2016, the following calendaryear data, on
Question:
Combining information from the S&P reports and some estimated data for 2016, the following calendar‐year data, on a per share basis, are provided:
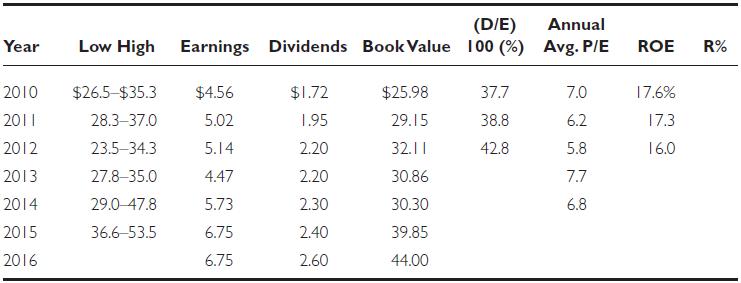
a. Calculate D/E, ROE and R% for 2013–2015. (Use the average of the low and high prices to calculate Rs.)
b. Show that from 2010 through 2015 the per annum growth rate in dividends was 6.9 percent and for earnings was 8.2 percent (both rounded).
c. Using the current price of $47, with estimated earnings for 2016 of $6.75, show that the P/E would be evaluated as 6.96.
d. On the basis of the annual average P/E ratios shown above and your estimate in (c), assume an expected P/E of 7. If an investor expected the earnings of PGJ for 2016 to be $7.50, show that the intrinsic value would be $52.50.
e. What factors are important in explaining the difference in the P/E ratios of Coca‐Cola and PGJ?
f. From your calculation of the growth rate of dividends in (b), assume that the annual rate is 7 percent. If the required rate of return for the stock is 12 percent and the expected dividend payout ratio is 0.4, show that P/E = 8.
g. If the dividend payout ratio is 0.4 and the ROE is 15 percent, show that g = 0.09.
h. Using k = 0.14 and g = 0.09, with expected 2016 dividends of $2.60, show that the intrinsic value is $52.
i. Assume that the “beta” for PGJ is 0.8 relative to Coke’s beta of 1.1. Is this information of any help in explaining the different P/E ratios of these two companies?
Step by Step Answer:
a b For dividend growth 1g 240172 1395349 15 1068899 g 69 There are five years betwee...View the full answer


Investments Analysis And Management
ISBN: 9781118975589
13th Edition
Authors: Charles P. Jones, Gerald R. Jensen
