

Refer to Figure 2 in the Appendix and assume that Q1 is $400 and Q2 is $500,
Question:
Refer to Figure 2 in the Appendix and assume that Q1 is $400 and Q2 is
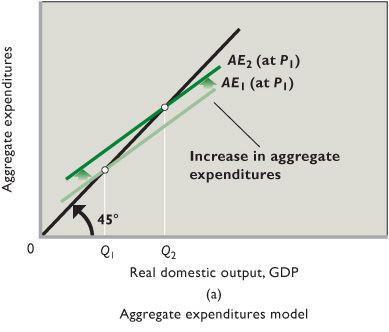
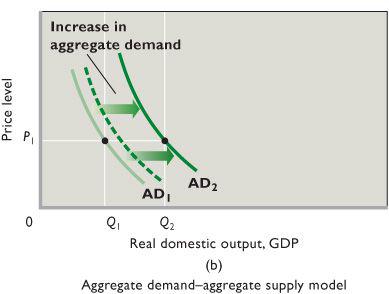
$500, the price level is stuck at P1, and the slopes of the AE lines in Figure 2a are .75 and equal to the MPC. In what direction and by how much does the aggregate expenditures schedule in Figure 2a need to shift to move the aggregate demand curve in Figure 2b from AD1 to AD2?
What is the multiplier in this example? Given the multiplier, what must be the distance between AD1 and the broken line to its right at P1?
Figure 2:
Fantastic news! We've Found the answer you've been seeking!
Step by Step Answer:

Answered By
Fahmin Arakkal
Tutoring and Contributing expert question and answers to teachers and students.
Primarily oversees the Heat and Mass Transfer contents presented on websites and blogs.
Responsible for Creating, Editing, Updating all contents related Chemical Engineering in
latex language
8+ Reviews
22+ Question Solved
Related Book For 

Macroeconomics
ISBN: 9780077337728
19th Edition
Authors: Campbell Mcconnell, Stanley Brue, Sean Flynn, Flynn Mcconnell Brue
Question Posted:
