The following diagram shows desired aggregate expenditure for the economy of Sunset Island. The (A E) curve
Question:
The following diagram shows desired aggregate expenditure for the economy of Sunset Island. The \(A E\) curve assumes a net tax rate \((t)\) of 10 percent, autonomous exports of \(\$ 25 \) billion, and a marginal propensity to import \((m)\) of 15 percent.
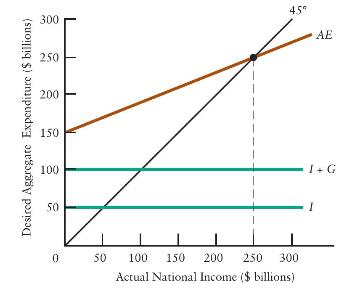
a. What is the level of desired investment expenditure (I)?
b. What is the level of government purchases \((G)\) ?
c. What is the autonomous portion of consumption?
d. What is total autonomous expenditure?
e. Starting from equilibrium national income of \(\$ 250 \) billion, suppose government purchases decreased by \(\$ 25 \) billion. Describe the effect on the \(A E\) curve and on equilibrium national income.
f. Starting from equilibrium national income of \(\$ 250 \) billion, suppose the net tax rate increased from 10 percent to 30 percent of national income. Describe the effect on the \(A E\) curve and on equilibrium national income.
g. Starting from equilibrium national income of \(\$ 250 \) billion, suppose investment increased by \(\$ 50 \) billion. Describe the effect on the \(A E\) curve and on equilibrium national income.
h. Starting from equilibrium national income of \(\$ 250 \) billion, suppose the marginal propensity to import fell from 15 percent to 5 percent of national income. Describe the effect on the \(A E\) curve and on equilibrium national income.
Step by Step Answer: