

The following four graphs represent four market scenarios, each of which would cause either a movement along
Question:
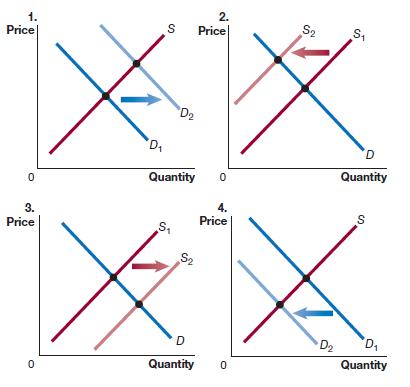
The following four graphs represent four market scenarios, each of which would cause either a movement along the supply curve for premium bottled water or a shift of the supply curve. Match each scenario with the appropriate graph.
a. A decrease in the supply of sports drinks
b. A drop in the average household income in the United States from $56,000 to $52,000
c. An improvement in the bottling technology for premium bottled water
d. An increase in the prices of electrolytes used in premium bottled water
Fantastic news! We've Found the answer you've been seeking!
Step by Step Answer:
Here are the matches for the four market scenarios with the appropriate graph a A decrease in the su...View the full answer

Answered By
Chiranjib Thakur
I have no tutoring experience yet, but I can share my skills and knowledge gained from my education and work experiences. I have been a CPA since 2012 with 6 years of work experience in internal auditing and 4 years of work experience in accounting at the supervisory level.
1+ Reviews
10+ Question Solved
Related Book For 

Question Posted:
