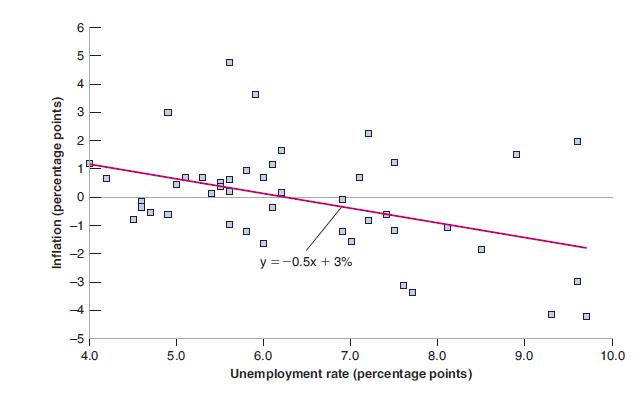
Using the natural rate of unemployment to predict changes in inflation The estimated Phillips curve from Figure
Question:
Using the natural rate of unemployment to predict changes in inflation The estimated Phillips curve from Figure 8.4 is
\[
\pi_{t}-\pi_{t-1}=3.0-0.5 u_{t}
\]
Fill in the table below using the data collected in Question 6. You will want to use a spreadsheet
a. Assess the ability of the Phillips curve to predict changes in inflation over the whole time period.
b. Assess the ability of the Phillips curve to predict changes in inflation during the crisis years 2009 and 2010? What do you think may be going on?
c. You will be able to add years after 2014 to your table. Assess the out-of-sample predictive ability of the expectations augmented Phillips curve estimated with the data ending in 2014 to predict inflation after 2014.
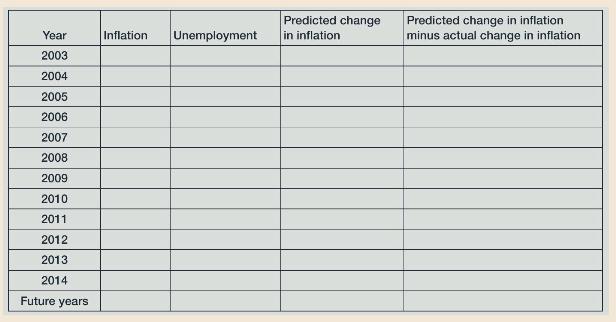
Figure 8.4
Data from question 6
The macroeconomic effects of the indexation of wages Suppose that the Phillips curve is given by
\[
\pi_{t}-\pi_{t}^{e}=0.1-2 u_{t}
\]
where
\[
\pi_{t}^{e}=\pi_{t-1}
\]
Suppose that inflation in year \(t-1\) is zero. In year \(t\), the central bank decides to keep the unemployment rate at \(4 \%\) forever.
Step by Step Answer: