Consider the money market to better understand the horizontal LM curve. a. What is on the left-hand
Question:
Consider the money market to better understand the horizontal LM curve.
![]()
a. What is on the left-hand side of equation (5.3)?
b. What is on the right-hand side of equation (5.3)?
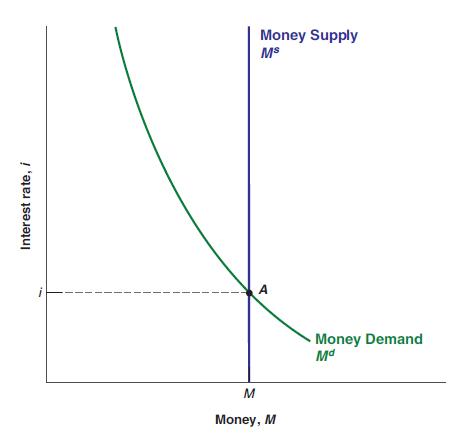
c. Go back to Figure 4-2. How is the function L(i) represented in that figure?
d. Modify Figure 4-2 to represent equation (5.3) in two ways.
How does the horizontal axis have to be relabeled? What is the variable that now shifts the money demand function? Draw a modified Figure 4-2 with the appropriate labels.
e. Use your modified Figure 4-2 to show that (1) as output rises, to keep the interest rate constant, the central bank must increase the real money supply; (2) as output falls, to keep the interest rate constant, the central bank must decrease the real money supply.
Data from Figure 4-2
Step by Step Answer:

This question has not been answered yet.
You can Ask your question!