

The accompanying table shows data on nominal GDP (in billions of dollars), real GDP (in billions of
Question:
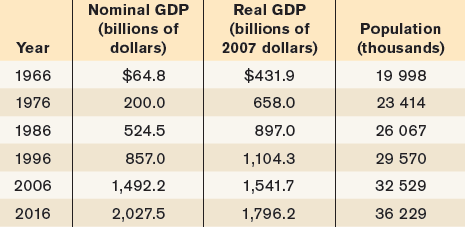
a. Why is real GDP greater than nominal GDP for all years until 2006 and lower for 2016?
b. Calculate the percent change in real GDP from 1966 to 1976, 1976 to 1986, 1986 to 1996, 1996 to 2006, and 2006 to 2016. Which period had the highest growth rate?
c. Calculate real GDP per capita for each of the years in the table.
d. Calculate the percent change in real GDP per capita from 1966 to 1976, 1976 to 1986, 1986 to 1996, 1996 to 2006, and 2006 to 2016. Which period had the highest growth rate?
e. How do the percent change in real GDP and the percent change in real GDP per capita compare? Which is larger? Do we expect them to have this relationship?
Step by Step Answer:
a Real GDP is greater than nominal GDP for all years until 2006 because the base year is 2007 and fr...View the full answer


Macroeconomics
ISBN: 978-1319120054
3rd Canadian edition
Authors: Paul Krugman, Robin Wells, Iris Au, Jack Parkinson
