

The accompanying table shows data on the total number of people in the United States and the
Question:
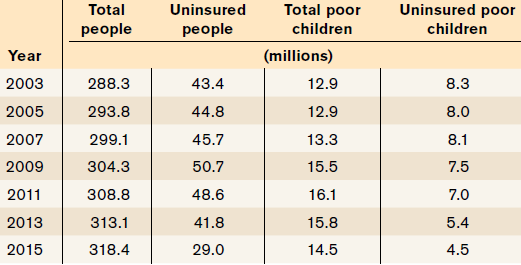
For each year, calculate the percentage of all people who were uninsured and the percentage of poor children who were uninsured. How have these percentages changed over time? What is a possible explanation for the change in the percentage of uninsured poor children?
Fantastic news! We've Found the answer you've been seeking!
Step by Step Answer:
The accompanying table calculates the percentages of all uninsured people in the United States and t...View the full answer

Answered By
OTIENO OBADO
I have a vast experience in teaching, mentoring and tutoring. I handle student concerns diligently and my academic background is undeniably aesthetic
3+ Reviews
10+ Question Solved
Related Book For 

Question Posted:
