Question:
An article in the Washington Post discussing comparisons of healthcare systems in different high-income countries noted that “the United States is known internationally for high-quality care. And its resources and capabilities in research and development of treatments made the United States a key player in the development of coronavirus vaccines.” However, the article also says that “meanwhile health care in the United States is the least affordable [among the countries being compared]. . . . U.S. doctors are the most likely to face difficulty in getting medication or treatment for patients because of restrictions on insurance coverage.” Use these observations and the information in Table 5.3 briefly discusses the difficulty of determining whether one country’s health care system is more successful than another country’s health care system. Your answer should indicate which goals are most important for a health care system to achieve.
data from table 5.3
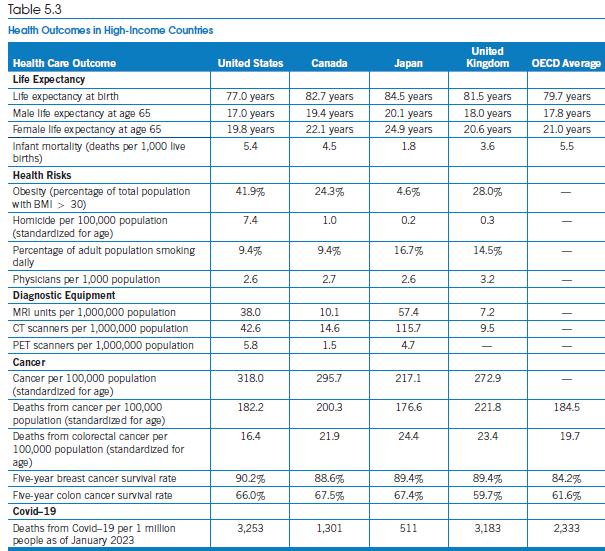
Transcribed Image Text:
Table 5.3 Health Outcomes in High-Income Countries Health Care Outcome United States Canada Japan United Kingdom OECD Average Life Expectancy Life expectancy at birth 77.0 years 82.7 years 84.5 years 81.5 years 79.7 years Male life expectancy at age 65 17.0 years 19.4 years 20.1 years 18.0 years 17.8 years Female life expectancy at age 65 19.8 years 22.1 years 24.9 years 20.6 years 21.0 years Infant mortality (deaths per 1,000 live 5.4 4.5 1.8 3.6 5.5 births) Health Risks Obesity (percentage of total population. 41.9% 24.3% 4.6% 28.0% with BMI >30) Homicide per 100,000 population 7.4 1.0 0.2 0.3 (standardized for age) Percentage of adult population smoking 9.4% 9.4% 16.7% 14.5% dally Physicians per 1,000 population 2.6 2.7 2.6 3.2 Diagnostic Equipment MRI units per 1,000,000 population 38.0 10.1 57.4 7.2 CT scanners per 1,000,000 population 42.6 14.6 115.7 9.5 PET scanners per 1,000,000 population 5.8 1.5 4.7 - Cancer Cancer per 100,000 population 318.0 295.7 217.1 272.9 (standardized for age) Deaths from cancer per 100,000 182.2 200.3 176.6 221.8 184.5 population (standardized for age) Deaths from colorectal cancer per 16.4 21.9 24.4 23.4 19.7 100,000 population (standardized for age) Five-year breast cancer survival rate 90.2% 88.6% 89.4% 89.4% 84.2% Five-year colon cancer survival rate 66.0% 67.5% 67.4% 59.7% 61.6% Covid-19 Deaths from Covid-19 per 1 million people as of January 2023 3,253 1,301 511 3,183 2,333